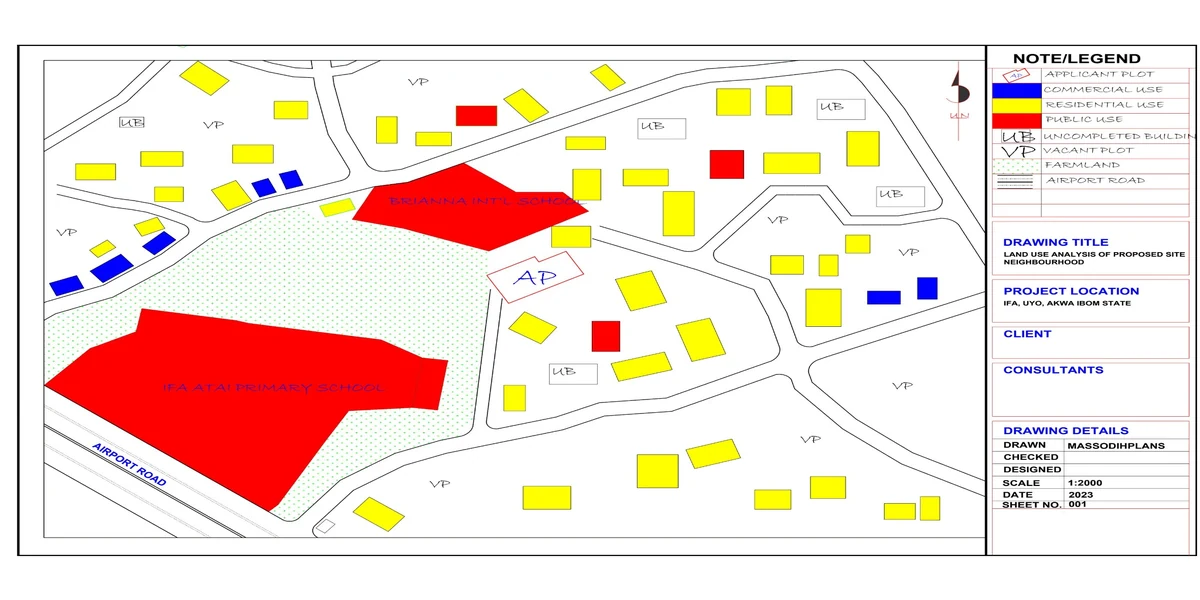
How to Draw a Neighbourhood Plan (SPAR): Step-by-Step Guide to Roads, Plots, Land Use, Setbacks and Layout Design
SPAR Site Planning, Analysis and Report is one of the first exercises where a planning student stops describing a neighbourhood and starts designing one. It’s also where most students discover that “design a residential neighbourhood for 8,000 people” is a much harder instruction than it sounds, because nobody ever showed them the actual sequence: what to draw first, what depends on what, and how a base map turns into a finished layout with roads, plots, zoning, and setbacks that actually work together.
That sequence is what this guide gives you. I’m a registered Town Planner, trained at the University of Uyo, and I’ve supervised and reviewed enough student layout designs to know exactly where they go wrong almost always in the same three or four places. This is written specifically for planning students, pupil planners, technicians, and the lecturers guiding them, and it walks through the full SPAR process in the order you should actually work through it, not the order most textbooks present it in.
What SPAR Actually Requires (Before You Touch a Drawing Board)
SPAR is not just “draw a layout.” It’s three connected outputs, and each one feeds the next:
Site Planning the actual physical design of the neighbourhood: roads, plots, land use zones, setbacks, and layout
Analysis the data and reasoning behind your design decisions: population, density, existing conditions, land use standards
Report the written document that justifies your design choices with the analysis and applicable planning standards
A common mistake is treating these as three separate tasks done in sequence analyze, then design, then write the report as an afterthought. In good practice, and in what actually earns marks, the analysis directly shapes the design, and the report explains that reasoning rather than describing the drawing after the fact.
Before you draw a single line, write down your project’s population target, expected density, and land area in one sentence. Every design decision that follows road width, plot size, number of facilities should trace back to that sentence. If it doesn’t, you’re designing decoratively, not analytically, and that’s usually where marks are lost.
How to Draw a Neighbourhood Plan (SPAR): Step-by-Step Guide to Roads, Plots, Land Use, Setbacks and Layout Design
Step 1: Secure and Study Your Base Map
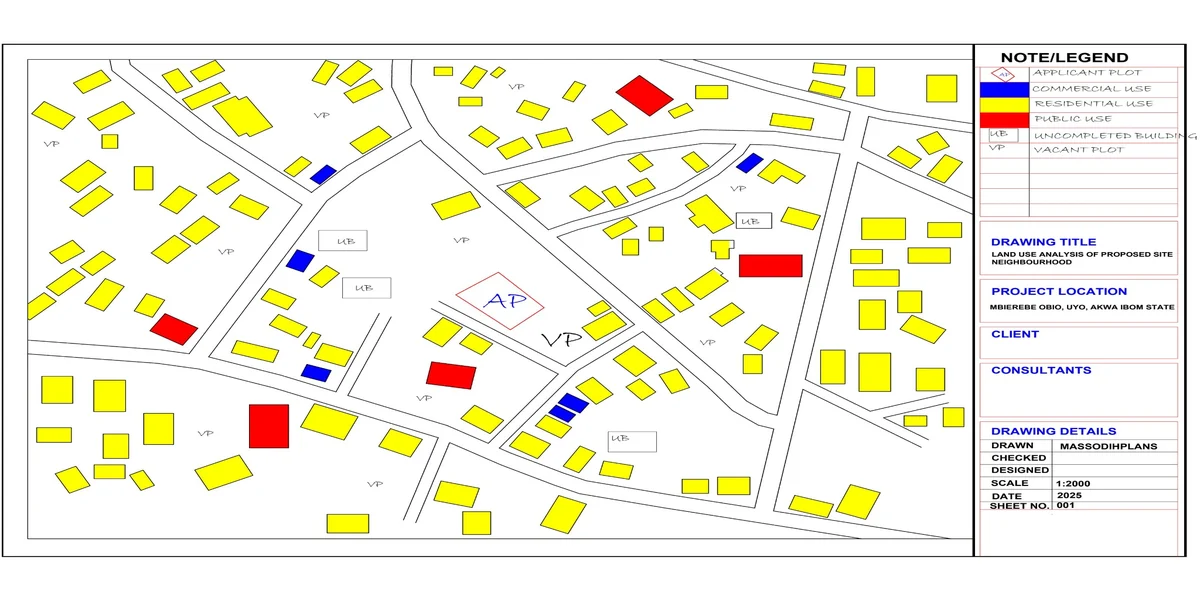
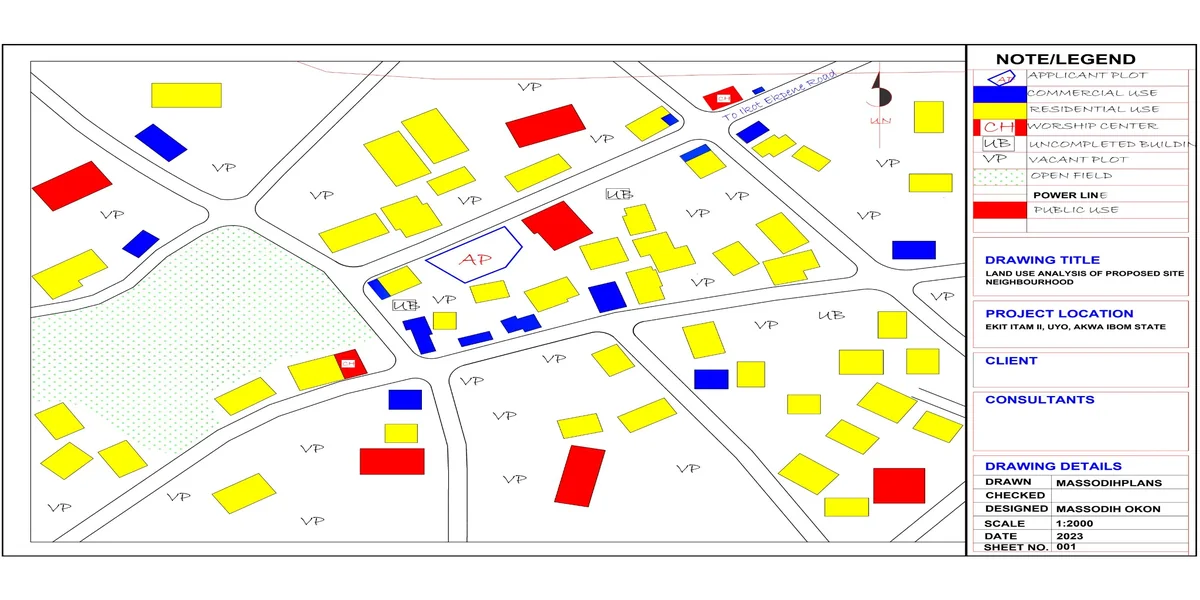
Your base map is the site’s existing topography, contours, existing access points, water bodies, and boundary usually provided by your department or obtained from a survey. Before designing anything, study it for:
Topography and slope steep gradients affect road alignment and drainage direction; you cannot ignore contours when placing roads without creating drainage and erosion problems
Existing access points where the site meets existing public roads, since your internal road network must connect logically to these, not float independently
Water bodies and drainage channels these constrain where you can place plots and roads, and often dictate your green space and recreation zone locations
Site orientation relevant later for building orientation guidance in your report, even though SPAR typically stops at layout level, not individual building design
Trace or scan your base map at a clear working scale 1:2500 or 1:5000 is standard for neighbourhood-scale layouts, with a final presentation drawing often at 1:2500 or 1:1000 depending on site size and your department’s requirement. Confirm your specific required scale with your handbook or supervisor, since this varies by institution.
Step 2: Determine Population and Density (The Analysis That Drives Everything)
This step is where most weak SPAR submissions fail, because students design the layout first and calculate population as an afterthought backwards.
Apply Neighbourhood Unit Theory
Most Nigerian planning curricula root neighbourhood design in Clarence Perry’s neighbourhood unit concept, which proposed self-contained residential areas sized around a population of roughly 5,000–10,000 residents, organized around a walkable radius (historically a quarter-mile, roughly 400 metres) to a central elementary school and neighbourhood facilities. Your project brief will usually specify a target population if it doesn’t, calculate a reasonable figure based on your site area and an appropriate density class for the location.
Calculate Density
Density is typically expressed as persons per hectare or dwelling units per hectare. Common density classifications used in Nigerian planning practice:
Low density: roughly 15–40 persons/hectare (large plots, typically 900 sqm+, low-rise single-family housing)
Medium density: roughly 40–100 persons/hectare (plots around 450–900 sqm, mix of bungalows and duplexes)
High density: 100+ persons/hectare (smaller plots, higher-rise or more compact housing forms)
These bands vary by state and institution, so confirm the specific figures your department or state planning standard uses before finalizing your calculation but the underlying method is consistent: total population target ÷ net residential density gives you the residential land area you need, and that figure anchors every other decision in your layout.
Household Size Assumption
Convert population to dwelling units using an assumed average household size (commonly 5–6 persons per household in Nigerian planning practice, though you should state and justify whatever figure you use). Population ÷ household size = number of dwelling units required, which then informs your plot count and sizing.
Never skip stating your assumptions household size, density classification, population target explicitly in your report. Examiners and lecturers are checking whether your design logically follows from stated assumptions, not just whether the final drawing looks tidy.
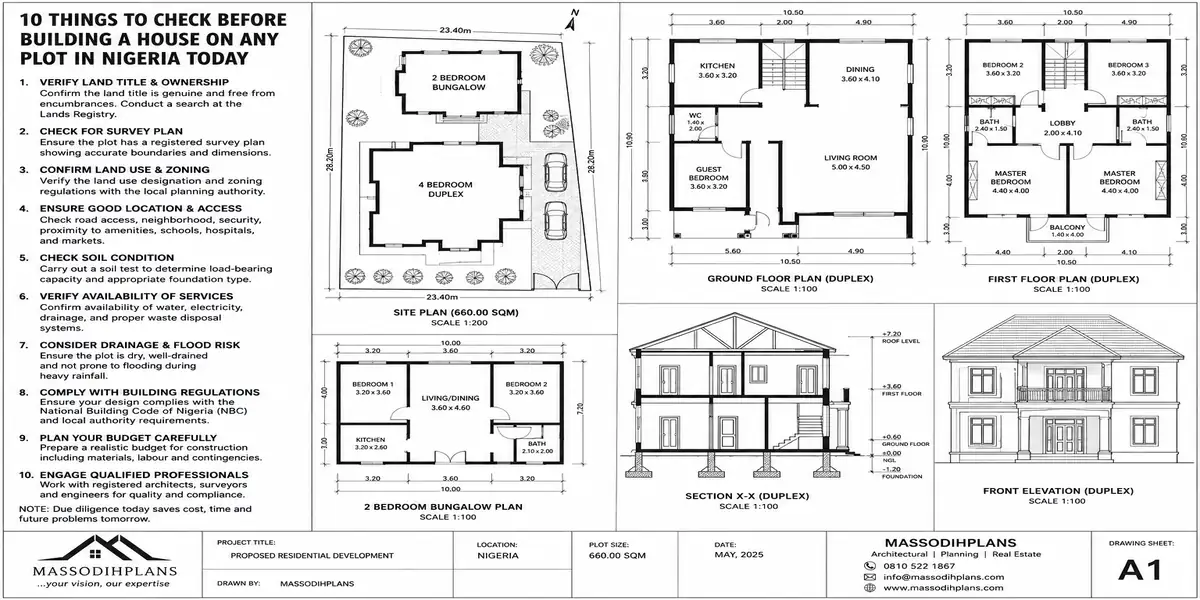
Neighbourhood Plans Deisgns
Step 3: Allocate Land Use (Zoning the Neighbourhood)
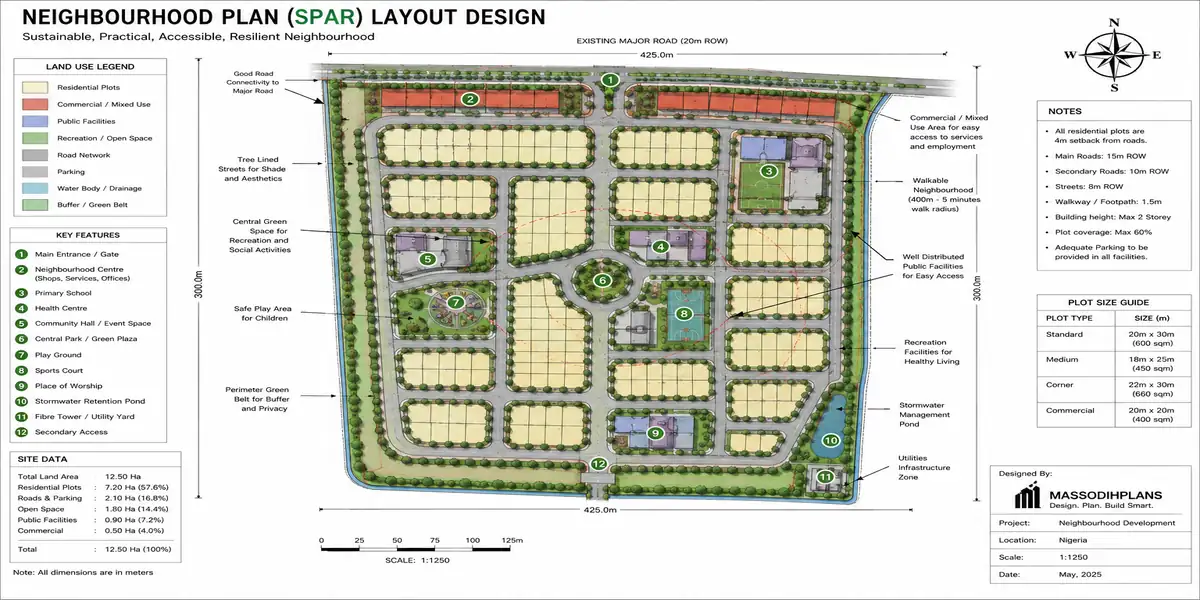
With your population and density established, allocate your total site area across land use categories. A commonly taught benchmark distribution for a residential neighbourhood layout looks roughly like this, though your specific project brief or department standard should always take precedence over these general figures:
| Land Use | Typical Share of Total Area |
|---|---|
| Residential | 45% – 55% |
| Roads and circulation | 15% – 25% |
| Open space / recreation / green areas | 10% – 15% |
| Institutional (schools, health centre, religious) | 5% – 10% |
| Commercial / neighbourhood centre | 3% – 8% |
Apply Central Place Reasoning to Facility Location
Neighbourhood facilities the primary school, health post, market, place of worship, playground should sit at points residents can reasonably walk to, generally within the same 400–800 metre radius logic drawn from neighbourhood unit theory. Placing your school at the edge of the site when most dwelling units are clustered at the opposite end is a design failure your report cannot talk its way out of, no matter how well-drawn the rest of the layout is.
Respect Site Constraints in Your Zoning
Steep slopes, water bodies, and flood-prone low points identified in Step 1 should generally become your open space and recreation zones, not your residential plots this is both good practice and an easy way to demonstrate in your report that your design responds to the site rather than ignoring it.
Step 4: Design the Road Hierarchy
Roads are usually the first lines drawn after zoning, because plots are subdivided against roads, not the other way around. A neighbourhood layout needs a clear road hierarchy, not a flat network of identical roads:
Primary/distributor roads connect the neighbourhood to the wider city road network; typically the widest roads in your layout, often 15–24 metres road reserve depending on projected traffic and your local standard
Secondary/collector roads distribute traffic from primary roads into the neighbourhood’s sub-areas; commonly 12–15 metres road reserve
Local/access roads directly serve individual plots; typically the narrowest, often 9–12 metres road reserve
Footpaths and pedestrian links especially important connecting residential clusters to schools, recreation areas, and neighbourhood centres without forcing pedestrians onto vehicular roads
Confirm exact road reserve widths against your state’s applicable urban and regional planning standard or your department’s design manual these figures are commonly taught benchmarks, not universal fixed values, and using outdated or wrong figures without acknowledgment is an easy way to lose marks in review.
Design Principles for the Road Network
Avoid a rigid grid imposed regardless of topography let primary roads follow the most logical connection points to existing access, and let local roads work within that framework
Minimize the number of access points onto the primary/distributor road, since too many junctions on a high-traffic road creates conflict points and undermines its function
Use cul-de-sacs and loop roads for local access to reduce through-traffic in purely residential clusters, but avoid excessive dead-ends that create poor emergency access and disconnected pedestrian routes
Ensure every plot has legal and physical road frontage a plot with no road access is not a usable plot, regardless of how neatly it fits your subdivision grid
Draw your road hierarchy in three passes, not one. First, place primary roads connecting to existing access points. Second, add secondary roads dividing the site into logical sub-areas. Only then draw local access roads within each sub-area. Students who try to draw the entire network in one pass almost always end up with roads that don’t relate to each other hierarchically.
SPAR
Step 5: Subdivide Plots
With roads drawn, subdivide the residential zone into individual plots.
Standard Plot Sizes
Common residential plot sizes used in Nigerian layout practice include roughly 450 sqm (15m x 30m), 600 sqm (20m x 30m), and 900 sqm for lower-density zones but your plot size should be derived from the density calculation in Step 2, not chosen arbitrarily. If your density calculation requires smaller plots to accommodate your target population within your available residential land, your layout should reflect that, and your report should show the working.
Block Design
Group plots into blocks between roads, typically with plots backing onto each other (back-to-back) to minimize road frontage length per plot and maximize efficient land use. Avoid oddly shaped or leftover plots created where road alignments don’t meet cleanly these are usually a sign the road network needs adjustment, not that the plot layout should simply absorb the irregularity.
Corner Plots and Irregular Geometry
Corner plots typically need slightly larger dimensions to accommodate setback requirements on two road-facing sides rather than one. Where your site boundary is irregular, resist the urge to force a rigid grid across the whole site let the plot grid adapt to boundary geometry at the edges while keeping regular plots in the main body of the layout.
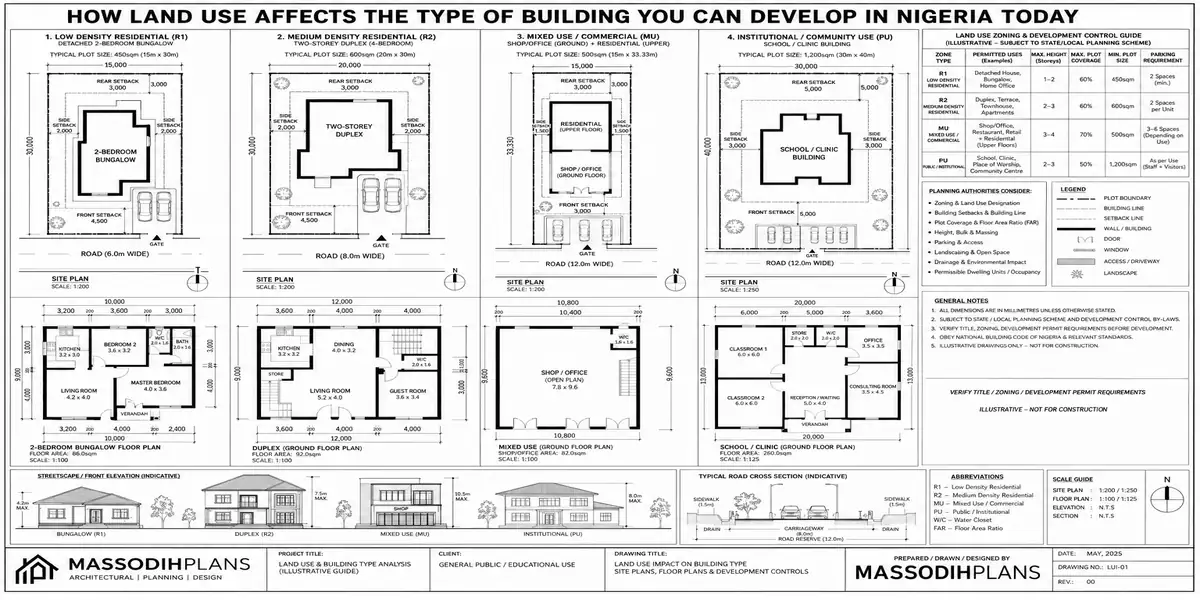
Step 6: Apply Setbacks and Building Lines
Setbacks are the minimum distances a building must sit back from plot boundaries and road edges, and they need to be shown on your layout, not just mentioned in your report.
Front setback (building line) distance from the road reserve boundary to the building; commonly 3–6 metres for residential plots depending on road classification (larger setbacks typically required along primary/distributor roads)
Side setbacks commonly 1.5–3 metres per side for residential plots, though this varies with plot size and local standard
Rear setback commonly 3 metres, sometimes more where plots back onto a road or public space
These figures are general teaching benchmarks always confirm the specific setback standard your department or the relevant state’s building/planning regulation requires, and cite that standard explicitly in your report rather than presenting generic figures as if they were universal.
Setbacks aren’t just a compliance box to tick they exist to preserve light, ventilation, drainage paths, and emergency access between buildings. When your report explains a setback figure, explain what it’s protecting, not just that a rule requires it. This is usually the difference between a report that recites standards and one that demonstrates actual understanding.
Step 7: Integrate Drainage and Infrastructure
A layout that looks complete but ignores drainage is an incomplete layout, even if your department doesn’t grade infrastructure as heavily as the physical layout.
Align road gradients and drainage channels with your site’s natural topography from Step 1, directing stormwater toward existing natural drainage points or your designated open space zones rather than against the slope
Reserve corridors along roads for utility lines (power, water, sometimes sewage) these are typically accommodated within the road reserve width, which is one more reason road reserve sizing matters beyond just traffic capacity
Show your primary drainage channels on the layout drawing itself, not only described in the report a layout that mentions drainage in the text but shows none on the drawing reads as an afterthought
Step 8: Drawing Conventions and Presentation
A technically sound layout can still lose marks for poor presentation. Standard conventions to follow:
Title block project title, your name/matric number, scale, date, and north point on every sheet
North point always shown, oriented consistently across all your drawings for the same project
Legend/key every land use colour or hatch pattern, road classification line-weight, and symbol used must be defined
Consistent scale state your scale clearly and keep it consistent across the layout drawing, unless a detail inset is explicitly labelled at a different scale
Line-weight hierarchy primary roads, secondary roads, and local roads should be visually distinguishable by line weight, not just by a label you hope the reader finds
Colour or hatch coding for land use consistent, legible, and matching your legend exactly
Whether you’re working in AutoCAD, a GIS package, or by hand, these conventions apply the same way software doesn’t replace correct drawing discipline, it just makes it faster to execute once you know what correct looks like.
Step 9: Write the Report to Match the Design
The report isn’t a summary of what you drew it’s the justification for why you drew it that way. A strong SPAR report typically follows this structure:
- Introduction and project brief site location, population target, project objectives
- Site analysis topography, existing conditions, constraints and opportunities identified in Step 1
- Population and density analysis your working from Step 2, with assumptions stated explicitly
- Land use allocation and justification your zoning breakdown from Step 3, explained against standards and site conditions
- Road hierarchy and circulation rationale why your road network is structured as it is, referencing Step 4’s principles
- Plot layout and density justification how your plot sizes and block design deliver the density target from Step 2
- Setback and building line standards applied with reference to the specific standard used
- Infrastructure and drainage considerations your Step 7 reasoning
- Conclusion summary of how the design meets the original brief
Write your report alongside your design, not after it’s finished. Every time you make a design decision a road width, a setback figure, a facility location write the one-sentence justification immediately. Reconstructing your reasoning after the drawing is done almost always produces a weaker, more generic report than capturing it in the moment.
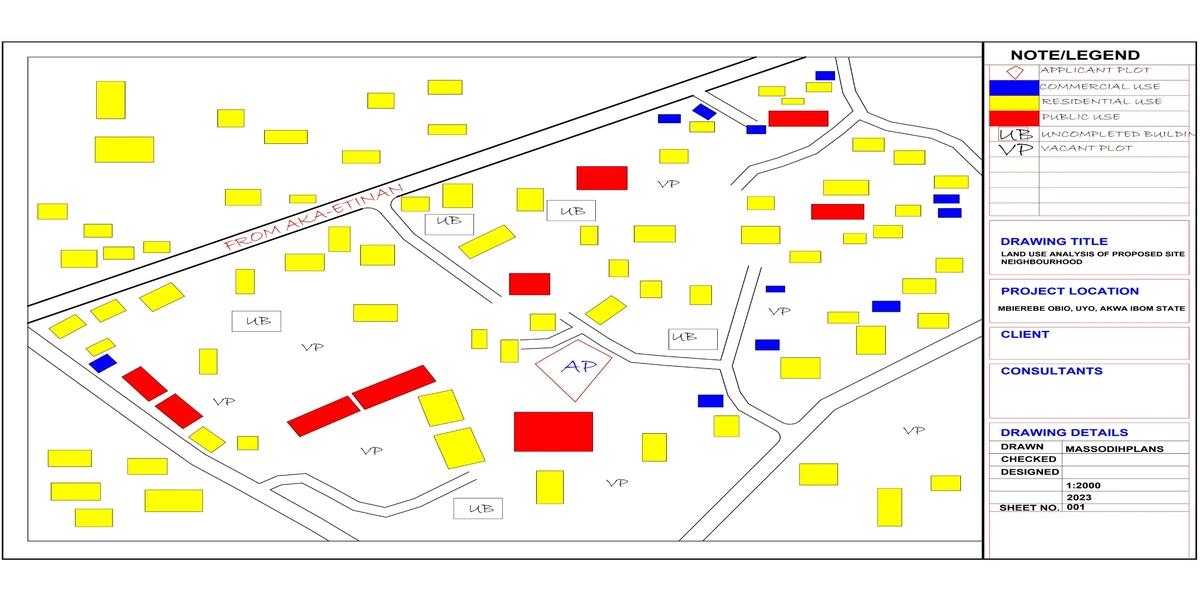
Site Plan Analysis
Common Mistakes That Cost Marks in SPAR Submissions
Designing the layout before calculating population and density producing a plausible-looking plan with no analytical basis behind it
Ignoring site topography and drainage when placing roads and plots, creating a layout that would flood or erode if actually built
A flat road network with no hierarchy every road drawn at the same width and importance, with no distinction between distributor, collector, and access roads
Facilities placed without walking-distance logic a school or market dropped into leftover space rather than positioned for genuine neighbourhood accessibility
Setbacks mentioned in the report but not consistently shown in the drawing
A report that describes the drawing rather than justifying it restating “the road is 12 metres wide” instead of explaining why 12 metres was the correct choice for that road’s classification and traffic role
Inconsistent or missing legend, scale, or north point presentation errors that undermine an otherwise sound technical design
Frequently Asked Questions
What does SPAR stand for in town planning?
Site Planning, Analysis and Report a combined exercise where students design a neighbourhood layout, support it with analytical reasoning (population, density, site conditions), and document both in a written report.
What scale should a neighbourhood layout plan be drawn at?
Commonly 1:2500 or 1:5000 for working and analysis stages, often finalized at 1:2500 or 1:1000 for presentation, but always confirm your specific department or project requirement, since this varies by institution and site size.
How do I calculate the number of plots needed in a neighbourhood plan?
Divide your target population by your assumed average household size to get the number of dwelling units required, then divide your available residential land area by your target plot size to check that your layout can physically accommodate that number of units at your intended density.
What is the ideal population for a neighbourhood unit?
Classical neighbourhood unit theory, following Clarence Perry, suggests roughly 5,000–10,000 residents organized around a walkable radius to a central school and neighbourhood facilities, though actual project briefs may specify different targets based on site size and local planning standards.
Do I need to show drainage on a neighbourhood layout plan?
Yes. Drainage direction and primary channels should be shown on the drawing itself, aligned with the site’s natural topography, not only described in the accompanying report.
Final
A neighbourhood plan that earns strong marks in SPAR isn’t the one with the most polished rendering it’s the one where every line on the drawing traces back to a stated population target, a density calculation, a site condition, or a planning standard, and where the report makes that chain of reasoning visible rather than assumed. Work through base map analysis, population and density, land use allocation, road hierarchy, plot subdivision, and setbacks in that order, and the report will largely write itself because you’ll already know why you made every decision.
If you’re building your planning knowledge further, visit Plan School for more studio and technical guides aimed at planning students and practitioners, or browse Plans Library to see how these principles translate into individual building layouts. For direct project or academic support, our Services page outlines how we can assist. You can also explore more town planning and architecture guides on our Homepage. See Requirement for permit
Related Guides
- Semi-Detached House Plans: Modern Duplex and Bungalow Designs With Shared Walls, Dimensions, Costs and Layout Ideas
- How to Draw a House Layout Plan: 10 Step-by-Step Guide From Plot Dimensions to Rooms, Doors, Windows and Setback
- Courtyard House Plans: Beautiful 2–6 Bedroom Designs With Private Outdoor Spaces, Floor Plans and Dimensions
- Contemporary House Plans: Modern 2–6 Bedroom Designs With Open Layouts, Large Windows, Dimensions and Costs
- House Finishing Cost in Nigeria: Complete Breakdown of Tiles, Painting, Ceiling, Doors, Plumbing and Electrical Work
- Foundation Cost Calculator: Estimate House Foundation Cost From Soil Type, Dimensions, Materials and Labour
- Block Quantity Calculator: How to Calculate the Number of Blocks Needed for Any House From Your Floor Plan
- Cement Quantity Calculator for Building: Calculate Bags Needed for Foundation, Blockwork, Slab, Plastering and Screeding
- Self-Contained House Plans: 15 Efficient Designs With Room Dimensions, Floor Plans, Building Costs and Ideas
- 1 Bedroom House Plan: Affordable Self-Contained Floor Plans With Dimensions, Materials, Cost and Space-Saving Ideas
- 6 Bedroom House Plans: Modern Nigerian Floor Plans With Dimensions, Ensuite Rooms, Parking and Cost Estimates