How GIS Is Solving Nigeria’s Urban Planning Crisis (With Real Examples)

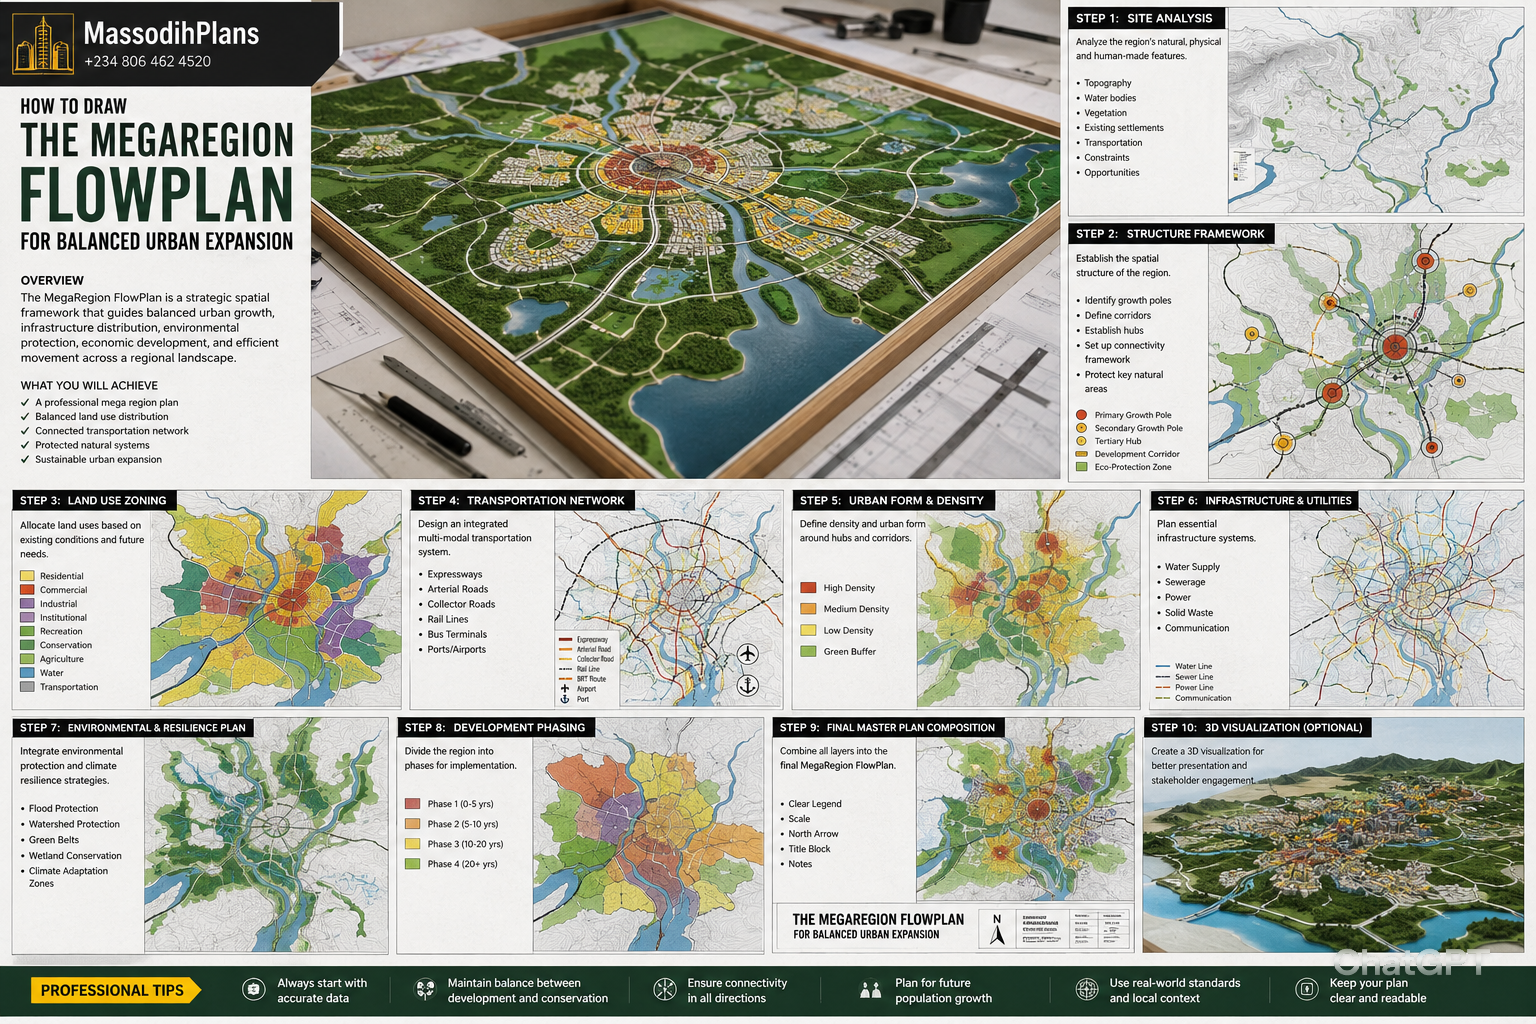
A detailed GIS-generated urban land use map showing zoned areas in a Nigerian city. GIS applications in urban planning make this kind of spatial analysis possible.
If you have ever looked at a Nigerian city and asked yourself: ‘Why is everywhere so scattered? Why does water flood our streets every rainy season? Why are houses built on top of drainage channels?’ the answer is almost always the same. We planned with our eyes closed. GIS — Geographic Information System is the technology that opens those eyes. And in this article, I am going to show you, with very real examples, exactly how GIS applications in urban planning are solving the problems that have chased us for decades. This is not theory. This is what I have used and seen on the ground.
Before I go deeper, let me answer the question directly: GIS helps urban planners see the city as a living map. It shows where buildings are, where floods happen, where roads are overcrowded, where land is being grabbed illegally, and where the next school or hospital should go. That is the simple truth. Everything else I explain in this article will build on that foundation.
NIGERIAN REALITY LAYER
In most Nigerian cities today, town planning decisions are still made by looking at old paper maps, some drawn over 40 years ago.
Streets that have doubled in size, communities that have grown from 500 to 50,000 people, and drainage channels that have been built over none of this appears on those old maps.
GIS changes that. It gives planners a live, accurate picture of what is actually happening on the ground right now.
This is why NITP, TOPREC, and state ministries of lands across Nigeria are now adopting GIS as a standard tool for urban management.
What Is GIS and Why Should Urban Planners Care?
During my undergraduate studies in Town Planning at the University of Uyo, GIS was introduced to us as a ‘spatial decision-making tool.’ But that phrase sounded academic and cold. What it really means is this: GIS is software that lets you put real information on a real map and then ask that map questions.
You can ask: Which areas flood every year? Where are people building without approval? How far is the nearest hospital from this settlement? Which roads cannot handle another thousand vehicles? And the map answers you visually, clearly, instantly.
For urban planners in Nigeria and across the world, that is not a small thing. It is everything. Because most of the planning problems we face from Uyo to Lagos to Kano to Port Harcourt come from not knowing what is actually on the ground before making decisions.
| GIS Capability | Urban Planning Benefit |
| Land Use Mapping | See exactly what is built where and detect illegal development |
| Flood Zone Analysis | Identify which areas flood and stop people from building there |
| Road Network Analysis | Plan better roads and detect bottlenecks before they get worse |
| Population Mapping | Know where people are concentrated and plan services accordingly |
| Utility Mapping | Track pipes, cables, drains across the entire city |
| Environmental Monitoring | Detect deforestation, wetland loss, and illegal dumping |
| Boundary Delineation | Resolve land disputes with accurate, verified boundaries |
| Development Control | Monitor building activity across the city from one platform |
Real-World GIS Applications in Urban Planning: The Problems and the Solutions
Let me take you through the biggest urban planning problems and show you exactly how GIS has been used in Nigeria and around the world to tackle each one. I have seen many of these situations personally, and I want you to understand them the way a practitioner understands them, not the way a Wikipedia article explains them.
1. Tackling Uncontrolled Urban Growth and Urban Sprawl
This is probably the most visible problem in Nigerian cities. You drive out of Uyo or Port Harcourt, and within ten minutes, you are passing houses that should not be there settlements that sprouted on agricultural land, wetlands, or government-reserved areas without any approval.
In my experience, the biggest reason this happens is that planning authorities simply cannot see the full picture. Nobody is monitoring the edges of the city where growth is happening fastest.
GIS solves this with satellite imagery and change detection. Planners can compare aerial images from two different years and see exactly where new structures have appeared. In Lagos State, the Ministry of Physical Planning uses GIS-based monitoring to track urban expansion along the Lekki corridor. They can detect new settlements emerging on wetland areas and deploy development control officers specifically to those locations.
In Abuja, the Federal Capital Development Authority (FCDA) uses GIS to monitor encroachments on government land. Areas that are being built upon without authorization show up on the map, and enforcement teams can be directed precisely.
CONSTRUCTION EXPERIENCE LAYER
I once reviewed a layout plan where the developer had already sold over 200 plots before anyone realized that a major portion of the site was sitting inside a government-gazetted forest reserve.
A GIS overlay of the government land boundaries against the developer’s survey plan exposed the conflict immediately.
Without GIS, that mistake would have taken years of legal battles and physical site visits to unravel.
With GIS, it took less than an hour to produce the evidence needed to halt the development.
- GIS satellite change detection flags new buildings on unapproved land
- Land boundary overlays expose encroachments on government reserves
- Urban growth models predict where sprawl will happen next, so plans can get ahead of it
- Informal settlement mapping helps governments understand the scale of the problem before deciding how to respond
2. Solving Traffic and Transportation Problems
Narrow roads. Blocked intersections. No parking. Pedestrians walking in the same lane as trailers. I have seen all of this during site visits in Uyo, in Aba, and in smaller towns across Akwa Ibom State. Traffic problems in Nigerian cities are not random. They are the direct result of roads that were never designed to handle the volume of people living on them today.
GIS-based transportation planning allows planners to model traffic flow before any road is built or widened. In Nairobi, Kenya, GIS traffic analysis identified seventeen critical intersections where signal timing changes alone reduced average delays by 30 percent. No new road was built. The existing roads were simply understood better.
Working alongside experienced planners in the field taught me that the question is never just ‘where is the traffic?’ The question is ‘where does the traffic come from, where is it going, and what is blocking it?’ GIS can answer all three.
- GIS Origin-Destination analysis shows where journeys start and end, guiding road and transit planning
- Road network modelling identifies missing links — roads that, if built, would take significant pressure off existing routes
- Accident hotspot mapping shows planners exactly where road design needs to change
- Public transport route planning uses GIS to position bus stops where they serve the most people
- Parking demand analysis shows areas with the worst shortage so targeted solutions can be designed
HUMAN LIFESTYLE LAYER
Think about a market woman who leaves Nung Udoe at 5am to get her goods to Itam market before the rush.
She spends 45 minutes in traffic that, on a GIS traffic model, shows up as a clear bottleneck at one junction that was never widened when the market doubled in size.
That woman’s time is money. Her children’s school fees depend on those morning hours.
When a road problem that GIS can identify in minutes takes ten years to address because no one mapped it, real lives suffer real consequences.
3. Addressing Housing Problems and Slum Formation
Slums do not appear by accident. Over the years, I have noticed that every slum I have visited followed the same basic story: people arrived faster than the city could plan for them. And because there was no plan ready, people built however they could, wherever they could.
GIS helps break this cycle in two ways. First, it maps existing slums so governments understand what they are dealing with the size, the population, the services missing, the structural risks. Second, it helps planners identify where the next wave of growth is coming and prepare land in advance.
In Mumbai, India, the Dharavi redevelopment project used GIS to map over 80,000 structures in one of Asia’s largest slums. That mapping exercise revealed that many residents had lived there for over 30 years information that shaped the legal and social framework of the entire redevelopment plan. You cannot solve what you cannot see.
For Nigerian states, GIS slum mapping is how you begin to talk seriously about urban renewal. Cross River State and Rivers State have both run GIS mapping exercises of informal settlements in Calabar and Port Harcourt respectively. The data produced population density, land ownership gaps, service deficits became the foundation for housing upgrade programmes.
4. Resolving Land Use Conflicts
I remember a project where a petrol station had been approved right next to a primary school. Nobody had checked. The land use map existed on paper in a ministry office, but no one used it when processing the approval. When a GIS-based land use layer was run, the incompatibility showed up within seconds.
Land use conflict is one of the most common sources of community tension in Nigerian cities. Markets in the middle of residential areas. Factories beside homes. Noisy worship centres in quiet neighbourhoods. These conflicts are avoidable with proper spatial planning, and GIS makes that planning practical.
INVESTMENT LAYER
For property investors in Nigeria, GIS-based land use maps are becoming a critical due diligence tool.
Before buying land or developing a commercial property, smart investors now commission GIS analysis to check:
- Whether the zoning permits their intended use
- Whether a conflicting land use is approved for a neighbouring plot
- Whether the site sits inside a flood zone or government right-of-way
- Whether road widening plans will affect the site in the next 10 years
This kind of spatial intelligence protects investment and reduces the risk of demolition or legal dispute.
- Zoning maps in GIS show permitted and prohibited uses for every parcel
- Buffer zone analysis automatically flags when an incompatible development is too close to a school, hospital, or residential area
- Change detection alerts planners when unapproved commercial activity invades a residential zone
- Noise and pollution modelling predicts which land uses will create environmental conflicts before approval is given
5. Planning Infrastructure: Water, Drainage, Electricity, Roads
During a site analysis assignment at the University of Uyo, we were asked to map the water supply network of a residential community. What we found was that a large portion of the community had no connection to the public water main, even though pipes passed within 200 metres of their homes. Nobody had extended the network because nobody had mapped the gap.
That experience stuck with me. Most infrastructure deficiencies in Nigerian cities are not about a lack of money or willpower they are about a lack of information. Planners do not know precisely where the gaps are, so they cannot target resources accurately.
GIS infrastructure mapping is the solution. It records the location of every water main, every transformer, every road surface type, every drainage culvert and then overlays that information with population data to show where service gaps are largest and most urgent.
| Infrastructure Type | How GIS Helps |
| Water Supply | Maps pipe network, identifies unserved areas, plans extension routes |
| Drainage Systems | Traces natural drainage, detects blocked channels, models flood paths |
| Electricity Grid | Maps coverage, identifies load hotspots, plans new lines efficiently |
| Road Network | Records surface quality, identifies roads needing urgent repair |
| Sewage Systems | Maps coverage, identifies areas discharging into open channels |
| Solid Waste | Maps collection routes, identifies dumping hotspots, plans transfer stations |
6. Flood Control and Drainage Planning
This is the GIS application I have encountered the most in my work. Flooding is the number one environmental crisis in most Nigerian cities, and almost every case I have seen was preventable.
In one housing layout project I reviewed in Akwa Ibom State, the developer had graded the entire site flat and filled a natural drainage swale that historically channelled water away from the area. When the first rainy season hit after development began, the neighbouring community flooded. Seriously flooded. Roads were impassable for three days.
A GIS Digital Elevation Model of that site would have shown the drainage swale immediately. It would have shown the downstream communities at risk. It would have made the planning authority think twice before approving a layout that blocked nature’s own drainage system.
CONSTRUCTION EXPERIENCE
During field inspections across South-South Nigeria, I have seen this pattern repeatedly: developers fill wetlands, block drainage channels, and grade away the natural slope of land all in the name of creating level plots.
The result is always the same. Water that used to flow freely now has nowhere to go. It backs up. And it spreads. It destroys.
GIS Digital Elevation Models and flood zone mapping exist precisely to prevent this. The technology is available. The challenge in Nigeria is that it is not yet consistently required before development approval is granted.
The United Nations Environment Programme has documented how Nigerian coastal cities, including Calabar, Warri, and Port Harcourt, face escalating flood risk due to the combined effects of climate change and unplanned urban development. GIS-based flood modelling is now considered essential for any serious urban master plan in flood-prone regions.
If you want to understand the full relationship between master plans and flood prevention, read our detailed article on Master Plan Preparation in Nigeria where I explain how drainage analysis feeds into the planning process.
- DEM-based flood modelling identifies areas at risk before anyone builds there
- Natural drainage channel mapping prevents developers from blocking critical watercourses
- Catchment area analysis shows how much water will flow through an area during heavy rain
- Erosion risk mapping guides decisions about where to allow dense development and where to maintain green buffers
- Post-flood damage mapping helps governments prioritize recovery and plan future defences
7. Managing Environmental Degradation
Deforestation. Wetland destruction. Industrial pollution. Poor waste management. These are not just environmental problems they are public health emergencies. And they are all happening in Nigerian cities in ways that a simple site inspection cannot fully capture.
GIS remote sensing tracks vegetation cover changes over time. In a city like Uyo, which had significant green cover twenty years ago, satellite-based NDVI analysis (Normalized Difference Vegetation Index) can show exactly how much tree cover has been lost and which areas are being deforested fastest. That information lets planners designate remaining green areas as protected open space before they disappear.
- NDVI mapping tracks vegetation loss and identifies areas needing reforestation
- Wetland boundary mapping protects sensitive ecosystems from development
- Industrial pollution plume modelling shows areas affected by factory emissions
- Waste dump site mapping identifies illegal dumping grounds for enforcement and clean-up
- Air quality monitoring stations can be spatially analysed in GIS to show pollution patterns across the city
8. Using GIS to Address Public Health Problems
One thing our lecturers constantly emphasized during Town Planning studio at the University of Uyo was that bad urban planning kills people. Not slowly, not invisibly it kills people through cholera outbreaks from contaminated water, through malaria from stagnant ponds left by blocked drainage, through respiratory disease from burning refuse. These are planning failures, and GIS is one of the tools we use to fix them.
Disease outbreak mapping in GIS is now used by health authorities in Lagos, Kano, and Enugu to track the spatial spread of communicable diseases. When cholera cases cluster around a particular water source, a GIS map makes that cluster visible in minutes. Authorities can then act on the water source not just treat the patients.
| Health Problem | GIS Application |
| Cholera Outbreaks | Map case locations against water sources to find contamination origin |
| Malaria | Map mosquito breeding sites (stagnant water) against case density |
| Respiratory Disease | Overlay pollution sources with population density and hospital admissions |
| Waste-related Illness | Map refuse dumps against proximity to residential and water areas |
| Maternal Health | Map distance from communities to health facilities to identify underserved areas |
| Childhood Malnutrition | Map food access, market locations, and income levels spatially |
9. Addressing Economic and Social Challenges Through GIS Planning
Poor urban planning is expensive. Not just for governments for every business, every family, every person trying to build a life in a city that was never designed with them in mind. High transportation costs because roads are inefficient. Reduced property values because incompatible land uses are neighbours. Poor investor confidence because nobody can tell you what land is zoned for what purpose.
GIS-based economic planning addresses these problems by making information available and trustworthy. An investor looking at a city with a fully functional GIS land information system can check the zoning of any plot, the infrastructure serving it, the flood risk, the proximity to roads — all in one place. That is the kind of transparency that attracts serious investment.
In Cape Town, South Africa, the City’s GIS portal is publicly accessible. Property developers, architects, engineers, and ordinary citizens can look up any parcel and see its zoning, services, flood risk, and approved developments nearby. The result is fewer disputes, faster approvals, and stronger investor confidence. Nigeria’s cities are moving in this direction, but the pace needs to accelerate.
INVESTMENT
If I were advising a real estate developer today, I would say this clearly: do not invest in any Nigerian city or town without first running a GIS analysis of your target area.
Check the flood zone. And check the zoning. Check the road plans. Check what is going up nearby.
Cities with functional GIS systems and accessible land information attract better investment and suffer fewer costly surprises.
Ask your town planner or come to our Services page to run that GIS analysis before you commit a single naira to land acquisition. Visit: https://massodihplans.com/services
10. Disaster Risk Reduction and Emergency Response
I have seen fire outbreaks spread through densely packed informal settlements where emergency vehicles could not get in because no road was wide enough. I have seen flood disasters where no one knew which buildings were at highest risk or which roads would be cut off first.
GIS disaster risk management maps vulnerabilities before disasters happen. It shows planners which communities have no emergency access route. And it shows fire stations which areas fall outside their seven-minute response radius. It shows flood emergency managers which residential areas will go underwater first when the river rises.
After the 2012 Kogi State flooding in Nigeria one of the worst in decades GIS mapping was used to document affected settlements, count displaced households, and plan relief distribution routes. The same spatial data later became the foundation for updated flood management plans in that region.
- Vulnerability mapping identifies communities at highest risk from floods, fires, and erosion
- Emergency access route analysis identifies settlements with inadequate road access for response teams
- Risk zone overlay maps combine flood risk, building density, and infrastructure quality to rank areas by disaster vulnerability
- Post-disaster damage mapping speeds up needs assessment and recovery planning
11. Solving Governance, Boundary Disputes, and Development Control
Land disputes are one of Nigeria’s most common legal conflicts. Two families claiming the same plot. A local government and a community disagreeing about who owns a piece of land. A private developer and a state government in court over a boundary line.
Based on my experience in planning and design, the root of most land disputes in Nigeria is the same: boundaries are not accurately recorded, not publicly accessible, and not consistently enforced. GIS changes all of that.
A properly maintained GIS land information system records every parcel, every boundary, every survey beacon. It shows ownership records, approval history, and legal status. When a dispute arises, the GIS record is the reference. It is not a matter of opinion. It is a spatial record with coordinates.
- Parcel-level GIS records eliminate ambiguity about land boundaries and ownership
- Development control officers can monitor building approvals spatially and detect unapproved structures
- Government land reserves are digitally recorded and protected against encroachment
- Revenue authorities use GIS to identify undervalued properties and improve land-based tax collection
- Local governments use GIS to track building permit applications and compliance across their jurisdiction
How GIS Integrates with the Master Plan Process
A master plan without GIS is like building a house without a site survey. You might build something, but you have no idea whether it fits the land it is sitting on.
This observation comes from practical field experience. Every serious master plan I have seen or worked on in recent years uses GIS at multiple stages. Let me walk you through exactly how that integration works.
Stage 1: Baseline Data Collection
Before any planning proposal is made, GIS is used to capture the existing situation. This includes land use mapping, road network tracing, infrastructure inventory, population density mapping, topographic analysis, and environmental sensitivity mapping. All of this data is layered in the GIS platform so that planners can see everything at once.
Stage 2: Analysis and Problem Identification
Once the baseline data is in GIS, the analysis begins. Where are the incompatible land uses? And where are the flood-prone zones? Where are roads overloaded? Where are communities underserved by schools, hospitals, or markets? This analysis phase is where GIS transforms raw data into planning intelligence.
Stage 3: Proposal Development
With the problems clearly mapped, planners use GIS to test different planning scenarios. What happens to traffic flow if a new road is added here? How does the flood risk change if a detention pond is built in this location? Where should the next residential zone be designated to absorb population growth without causing conflict? GIS lets planners model the answer before committing to any decision.
Stage 4: Land Use Distribution and Zoning
The master plan’s land use map showing where residential, commercial, industrial, institutional, and open space zones are designated is produced in GIS. This is the authoritative reference that development control officers, surveyors, and developers must consult when any building activity is proposed.
To understand how zoning works in practice, visit our detailed guide on the Plans Library at MassodihPlans where you will find house plan examples that reflect correct zoning standards for Nigerian residential areas.
Stage 5: Circulation and Road Hierarchy Planning
GIS is used to design the road network that serves the master plan area. Road hierarchy primary, secondary, and local roads is mapped with specific right-of-way widths. GIS ensures that roads connect logically, that all land parcels have access, and that the network can handle the projected population load.
Stage 6: Infrastructure Planning
Water mains, sewers, drainage channels, electricity lines, and telecommunications networks are all planned using GIS. The infrastructure network is designed to serve every zone in the master plan with the correct level of service.
Stage 7: Plot Layout and Setback Standards
Plot arrangements and building setback standards are recorded in GIS so that when subdivision surveys are done, the coordinates of plot boundaries can be verified against the master plan. This is how development control works in practice not by guessing, but by measuring against a spatial standard.
For a deeper explanation of planning standards including setbacks and plot ratios, explore our Plan School resource where I break down Nigerian physical planning standards in plain language.
Stage 8: Environmental Management and Open Space Allocation
GIS overlay analysis identifies which areas must be protected as open space, parkland, or environmental buffer zones. These areas are mapped and legally designated in the master plan so that future development cannot encroach on them. Green corridors, riparian buffers along rivers, and community recreation spaces are all recorded spatially.
Stage 9: Population Projections and Growth Management
GIS integrates population data with spatial analysis to project where growth will occur and what infrastructure will be needed. Smart growth concepts directing development to areas that are already served by roads and utilities are modelled in GIS to minimize the cost of new infrastructure provision.
Stage 10: Development Phases and Implementation
A master plan is not built overnight. GIS helps planners divide the plan into development phases short-term, medium-term, and long-term and map which infrastructure and land preparation needs to happen in each phase. This makes the plan investable and actionable, not just visionary.
Want to understand what a professional master plan document covers? Read our full article on Master Plan preparation on MassodihPlans for a step-by-step breakdown.
Climate-Responsive Urban Planning: What GIS Makes Possible
My academic training exposed me to climate-responsive planning as a theoretical concept. Field experience has shown me it is a survival necessity. Nigerian cities are already experiencing the consequences of climate change — longer droughts, more intense rain events, coastal flooding, extreme heat in urban centres. GIS is the tool that makes climate-responsive planning practical.
- Urban heat island mapping identifies areas where tree canopy cover is needed most urgently
- Sea level rise projections are overlaid on coastal city maps to identify at-risk land
- Carbon sequestration mapping shows how much carbon existing urban forests are storing and what we lose when they are cleared
- Renewable energy site suitability mapping identifies rooftops and open spaces suitable for solar installations
- Resilient drainage design uses GIS topographic analysis to route water safely through urban areas even under extreme rainfall conditions
How GIS Supports the Planning Approval Process in Nigeria
The planning approval process in Nigeria getting a Building Permit, Development Permit, or Change of Use approval has traditionally been slow, paper-heavy, and prone to error. GIS-backed digital planning systems are changing this.
Several State Urban Planning Authorities are now building GIS-integrated permit management systems where an applicant submits plans digitally, and the system automatically checks the proposed development against the land use map, the setback standards, and the flood zone. Applications that meet all criteria are flagged for fast-track approval. Applications that conflict with the plan are flagged for review.
This is not just efficiency. It is also transparency. When the approval decision is driven by data that is visible in GIS, it becomes much harder for approvals to be granted corruptly or for illegal developments to slip through undetected.
NIGERIAN REALITY LAYER
In my experience, many Nigerian planning approval delays are not caused by complex legal issues they are caused by the simple fact that nobody can quickly verify whether a proposed development is on land that is zoned for that purpose.
An officer has to trace through paper files, locate the relevant layout plan (which may be incomplete or outdated), measure distances by hand, and then make a judgment call.
A functioning GIS system replaces all of that with a three-minute spatial check.
Lagos State’s e-planning portal is a step in this direction. Other states need to follow.
Mistakes Urban Planners Make When Using GIS
This is something I have encountered many times, and I want to share it plainly because I see the same errors repeated across projects.
- Using outdated base maps. A GIS analysis is only as good as the data underneath it. If your satellite imagery is from 2010, your analysis reflects a city that may have doubled in size since then. Always use the most current available imagery.
- Collecting data without a plan to update it. GIS infrastructure maps lose value the moment they stop being updated. A water main that was mapped in 2018 may have been extended, broken, or replaced. Your GIS must reflect current reality.
- Treating GIS as a presentation tool rather than an analysis tool. I have seen reports where GIS maps are used purely as illustrations, with no actual spatial analysis done. That is a waste. GIS should drive the decisions, not just decorate the report.
- Ignoring community knowledge. GIS data captured from satellites and official records will miss things that residents know — seasonal drainage patterns, informal paths, flood spots that do not appear on any map. Ground-truthing GIS data with community participation produces much better results.
- Not integrating GIS with legal planning documents. A GIS map that sits in a software system but is not formally adopted into the gazetted plan has no legal weight. GIS outputs must be embedded in the official planning documents to have enforcement power.
Frequently Asked Questions
What is the most common GIS application in urban planning in Nigeria?
From what I have seen in practice, the most common application is land use mapping and development control using GIS to record what is built where and to check proposed developments against the approved land use plan. Flood zone mapping is the second most common, especially in South-South states.
Can small towns in Nigeria use GIS for urban planning?
Absolutely. GIS software ranges from expensive commercial platforms to free and open-source tools like QGIS. The data collection step can be done with smartphones and GPS devices. Small town planning offices, local government authorities, and community development groups can all adopt GIS at a scale that fits their budget. The key is starting even a basic land use map in GIS is infinitely more useful than no map at all.
How does GIS help with the preparation of a master plan?
GIS is used at every stage of master plan preparation: baseline data collection, site analysis, problem identification, proposal development, land use distribution, road hierarchy planning, infrastructure layout, zoning designation, and implementation phasing. A master plan produced without GIS is a plan produced without accurate spatial information, which means every decision it makes is based on incomplete understanding of the land.
Is GIS the same as satellite imagery?
GIS is the software system and analytical framework. Satellite imagery is one of many data sources that GIS uses. GIS can also use survey data, administrative records, census data, engineering as-built drawings, aerial photography, and field-collected GPS points. Satellite imagery is important, but it is just one input into a GIS-based planning analysis.
How does GIS support development control in Nigerian cities?
Development control using GIS allows planning authorities to record every approved building permit spatially on a map, detect when new construction starts without approval, check whether a proposed development complies with the approved land use plan, and identify illegal structures for enforcement action. It transforms development control from a slow paper-based process into a real-time spatial monitoring function.
What GIS software is used for urban planning in Nigeria?
The most widely used commercial GIS platforms globally are ArcGIS (by Esri) and QGIS (free and open source). Several Nigerian planning agencies use ArcGIS. Many universities, research institutions, and smaller planning offices use QGIS because of its zero cost and strong community support. Both platforms can handle all the analysis types discussed in this article.
Finally: GIS Is Not the Future of Nigerian Urban Planning. It Is Already the Present.
I did not learn this from a textbook alone. I learned it from walking sites, reviewing plans, discovering problems that could have been prevented, and watching communities suffer consequences that good spatial information would have avoided.
GIS applications in urban planning are not a luxury for wealthy cities in developed countries. They are a necessity for any community in Akwa Ibom, in Kano, in Lagos, in Enugu, in the smallest local government area in Rivers State that wants to grow in a way that works for people rather than against them.
The Nigerian cities that are getting this right that are mapping their land, analysing their risks, planning their growth with spatial intelligence are the cities that will attract investment, reduce disaster losses, provide better services, and give their residents a better quality of life.
The ones that are not doing this will keep spending emergency money rebuilding roads washed away by floods that were predictable, settling land disputes that should never have arisen, and explaining to residents why the hospital is forty minutes away from the fastest-growing part of the city.
The choice is not complicated. But it does require commitment.
NEXT STEPS FOR YOU
If you are a government agency or community leader who wants to understand how GIS can serve your planning process, reach out through our Services page we provide GIS-based planning analysis and master plan consultancy.
And If you are a student or young planner building your knowledge, explore our Plan School section for plain-language explanations of planning standards and methods.
If you are a developer or private individual trying to understand how your project fits within the urban plan, browse our Plans Library for house plan examples that reflect correct planning standards for Nigerian plots.
Visit: https://massodihplans.com to get started.
Explore More on MassodihPlans
- Master Plan Preparation in Nigeria: A Complete Guide
- Nigerian Estate Master Plan for Small Plots: Modern Residential Layout Strategies That Maximize Space
- MassodihPlans Homepage
- Small Residential Estate Layout Design in Nigeria: Smart Master Plan Ideas for Limited Land
- Industrial Estate Layout Design in Nigeria: Smart Master Plan for Small Industrial Plots
- What Makes a Good Estate Layout Plan? A Practical Guide for Nigeria and Beyond
- Cost of Master Plan Preparation for Communities and Institutions
- Architectural Engineering and Architectural Design Courses for House Building Plans
- Housing Estate Layout Plan: Why Every Estate Needs One in Nigeria and Beyond
- Commercial Development Planning Costs: What Every Investor Must Know Before Spending a Kobo
- Why District Planning Is Important for Urban Development
- Site Development Plan Cost: What Every Property Owner Must Know Before Building
- Environmental Management Plan Cost Guide for Developers in Nigeria and Beyond
- Why Local Development Plans Matter for Communities
Authority Reference:
United Nations Human Settlements Programme (UN-Habitat) — World Cities Report: Envisaging the Future of Cities the leading global reference on urban planning challenges and sustainable city development.