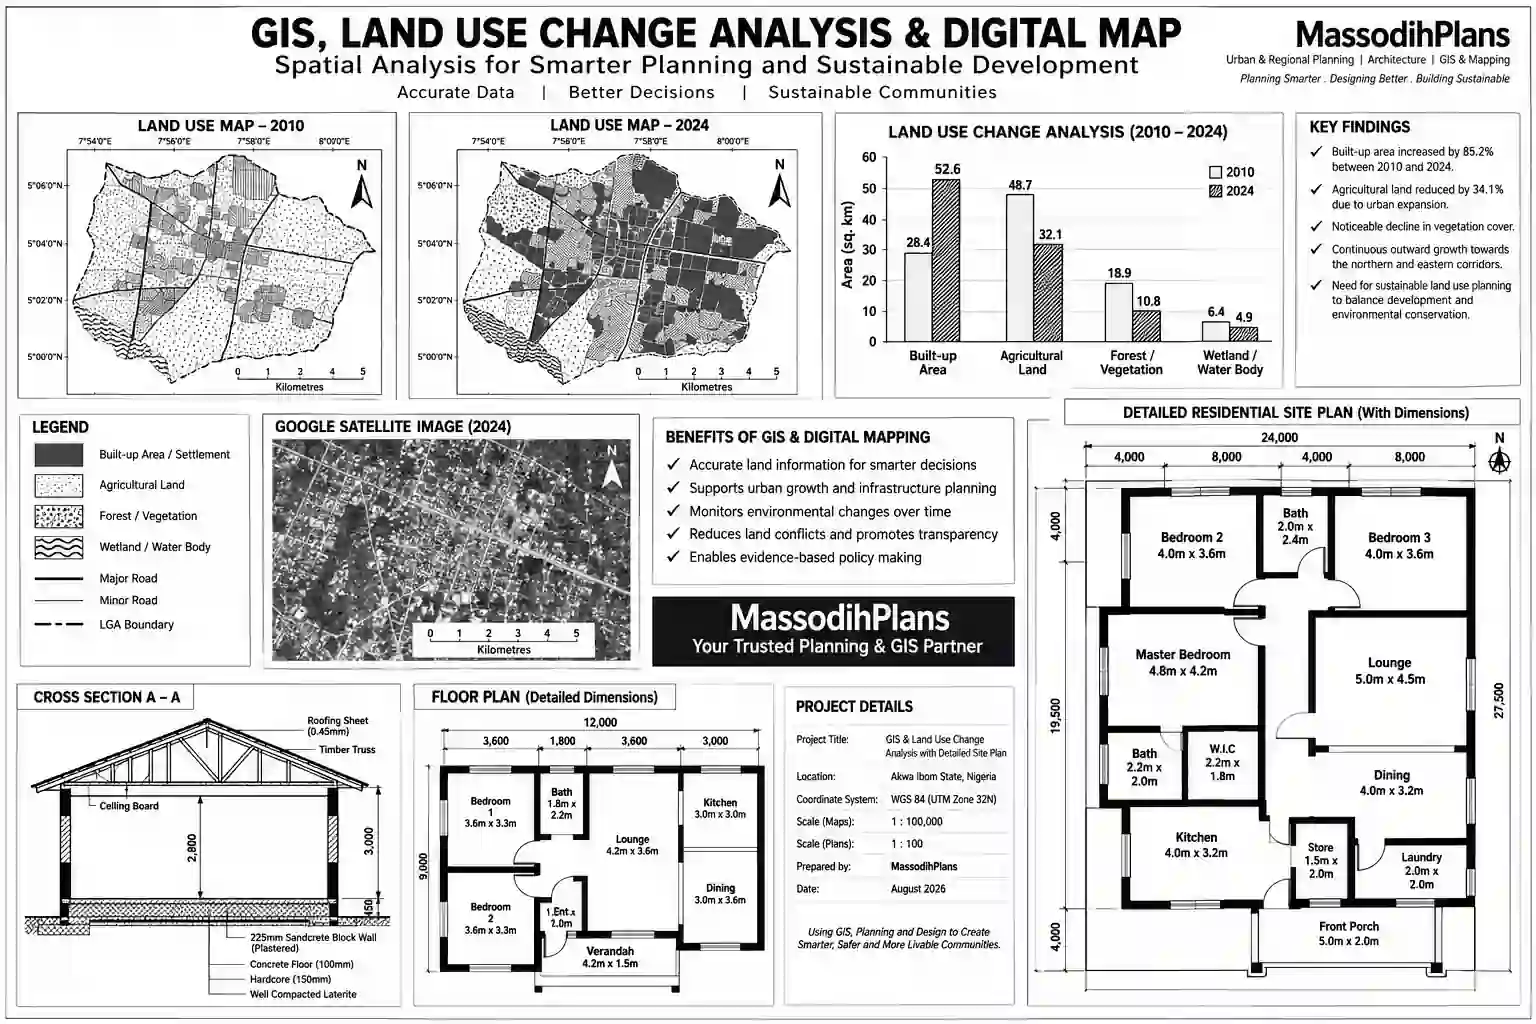
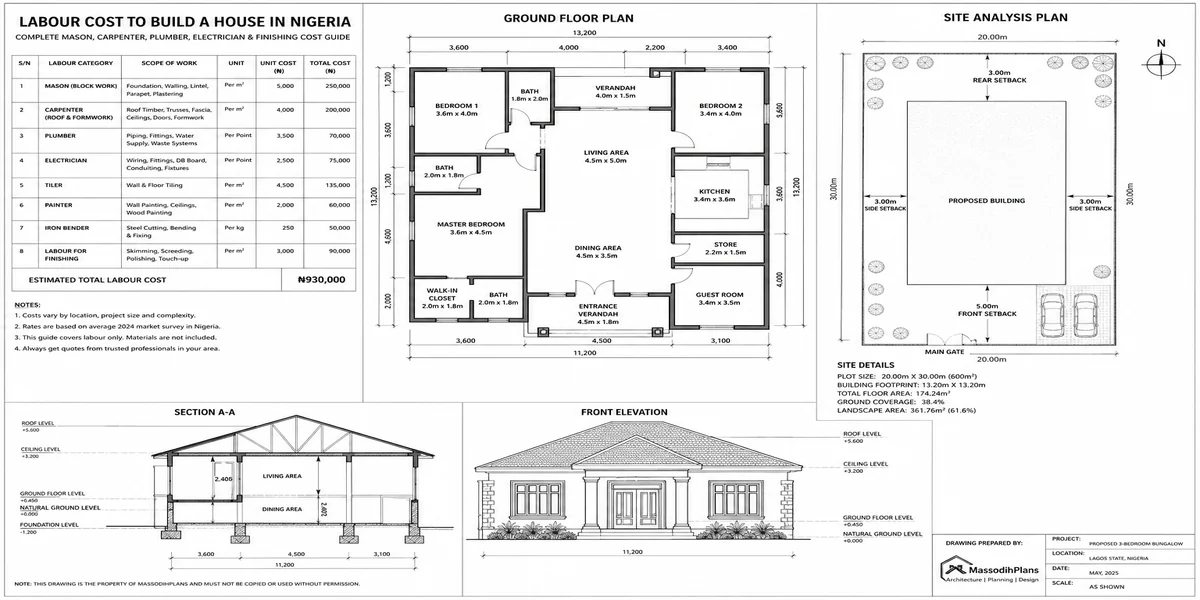
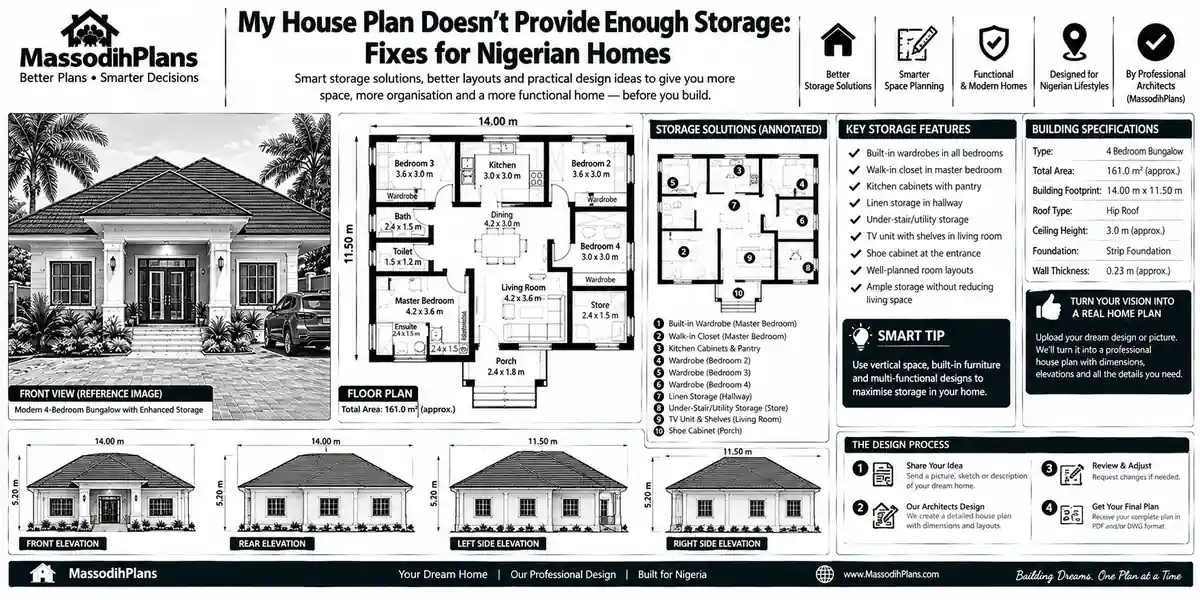
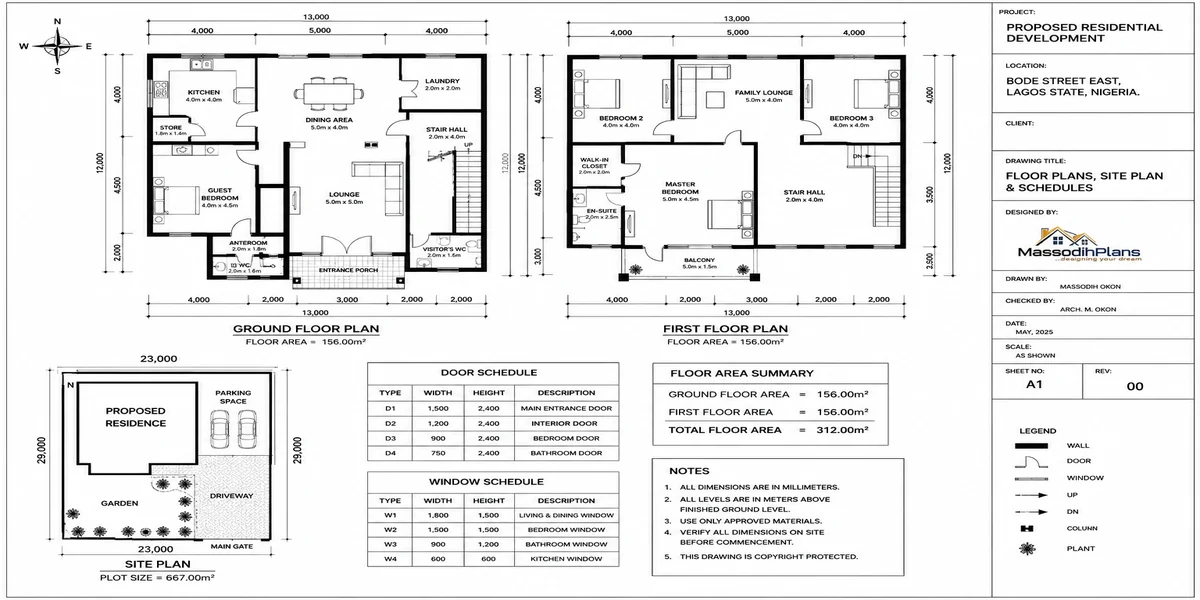
How Do I Do GIS Analysis for My Dissertation?
Your supervisor has said “add some GIS” to your dissertation three times now, and you still don’t know what that actually means for your Tuesday. You’ve opened QGIS or ArcGIS, stared at an empty canvas, closed it, and gone back to Google. If that’s where you are right now, good you’ve come to the right page, and I’m not going to waste your time with a textbook definition of “what is GIS” before I get to the part that matters.
I’ve supervised, examined, and personally produced GIS-based spatial analysis for planning dissertations and consulting projects for years, trained formally in Geography and Urban and Regional Planning at the University of Uyo, and published work in the Journal of Environmental Design. I’m not writing this as a general tech explainer. I’m writing it the way I’d actually talk to a student sitting across from me with a deadline in six weeks and a chapter three that isn’t writing itself.
First, Let’s Fix the Real Problem: You Don’t Have a “GIS Problem,” You Have a Framing Problem
Here’s what almost nobody tells students directly: most of the struggle with GIS in a dissertation isn’t technical. It’s that you’re trying to learn software before you’ve decided exactly what question the software is supposed to answer. That’s backwards, and it’s why so many students spend three weeks “learning GIS” and still can’t produce a single usable map for their results chapter.
Before you open any software, you need one sentence, written down, that says exactly what spatial question your dissertation is answering. Not “I want to use GIS to analyze flooding” that’s a topic, not a question. Try: “Which specific areas within [your study area] have the highest flood risk based on elevation, drainage proximity, and land use?” That sentence alone tells you what data you need, what analysis method fits, and what your output map should show. Everything else in this guide builds from getting that sentence right first.
Once that’s locked, GIS stops being a mysterious skill and becomes a tool doing one specific job for you which, naturally, is also how good spatial analysis works when I’m picking a site for a client’s house, but we’ll come back to that connection later.
Choosing Your Software: The Decision That Actually Matters for Students
This is where I’ll save you real money and real stress, because almost every generic GIS guide online assumes you have institutional ArcGIS access and never discusses what happens when you don’t.
QGIS is free, open-source, and genuinely capable of everything most dissertations need overlay analysis, buffering, suitability mapping, interpolation, the works. If your university doesn’t provide a licensed ArcGIS seat, or you’re self-funding your study, start here. There is no shame in a QGIS-based dissertation; examiners care about your analytical thinking, not your software’s price tag.
ArcGIS Pro is the industry standard many supervisors default to recommending, often because that’s what they were trained on. If your institution provides free student access (many do through an Esri educational license), use it the tutorials and documentation are more abundant. But do not buy a personal ArcGIS license out of pocket as a student; it is expensive, and QGIS will get you to the same destination for most dissertation-level analysis.
R with spatial packages (sf, terra) is worth considering if your dissertation already involves statistical modelling it keeps your spatial analysis and your statistics in one reproducible script, which examiners increasingly like to see.
Pick your software based on what your data and your supervisor can actually support, not on what looks most “professional” on your CV. A clean, correctly-interpreted QGIS map beats a confused ArcGIS one in every viva I’ve sat on.
Now that software is settled, the next wall most students hit and it’s a bigger wall than people admit is getting data that’s actually usable.
The Data Problem Nobody Warns You About (Especially Outside the US and UK)
If your study area is in the US or UK, you’re fortunate data.gov, USGS Earth Explorer, and the UK’s Ordnance Survey and data.gov.uk portals are genuinely well-organized, and most dissertation guides online are quietly written with this assumption baked in.
If you’re studying an area in Nigeria, much of sub-Saharan Africa, or similarly data-sparse regions, that assumption breaks immediately, and this is exactly where most “how to do GIS” articles go silent. Here’s what actually works:
OpenStreetMap (OSM) crowd-mapped but surprisingly usable for road networks, land use, and points of interest once you clean it; free and global
Global satellite imagery (Landsat, Sentinel via Copernicus, SRTM for elevation) free, globally available, and the backbone of most African spatial dissertations I’ve supervised
National agencies Nigeria’s NIGIS/NASRDA and state-level ministries of lands and survey hold data, but access is slower and sometimes informal; start requesting early, not two weeks before submission
Your own fieldwork/GPS points for small study areas (a neighbourhood, a specific estate, a single LGA), ground-truthed GPS points you collect yourself are often more defensible in a viva than secondhand data of unclear origin
Google Earth Pro and Google Earth Engine free, and genuinely underused by students for quick digitizing and historical imagery comparison
For international readers in Germany, Switzerland, Canada, Australia, Singapore, and the UAE: each of these has strong national geoportals (Geoportal.de, swisstopo, Natural Resources Canada, data.gov.au, Singapore’s OneMap, and Dubai’s DM geoportal respectively) use your national portal first before reaching for global datasets, since locally sourced data is almost always more defensible to an examiner who knows the area.
Document where every single dataset came from, including the exact download date and source URL, in an appendix table. Examiners ask about data provenance far more often than students expect, and “I don’t remember where I got it” is the single most damaging answer you can give in a viva.
With data sourced, the next step is where I see students genuinely waste the most time: trying to run analysis before the data is actually ready to be analyzed.
Data Preparation: The Unglamorous Step That Decides Everything
This is the part Esri’s own guides correctly call the most time-consuming stage, and they’re right but nobody tells you why it specifically matters for a dissertation rather than a generic project.
Check and standardize your Coordinate Reference System (CRS) across every layer before anything else. A mismatched CRS doesn’t throw a helpful error message half the time it just silently misaligns your layers, and you can produce a beautiful-looking map that is analytically wrong without ever knowing it until your supervisor asks why the river appears to run through the middle of the market square.
Clean your attribute tables. Remove duplicate records, fix inconsistent naming (the same town spelled three different ways across datasets is extremely common with Nigerian administrative data), and fill or properly flag missing values rather than leaving blank cells that break your analysis tools later.
Clip your data to your actual study area boundary before running analysis, not after this saves processing time and keeps your output maps focused on exactly the area your dissertation question is about.
I say this often to my students in the lecture hall, and I’ll say it here too: na the data wey you clean well-well go save your life for defense day, because if your foundation data is rough, no amount of grammar for chapter four go hide am. Garbage in, garbage out na so GIS dey work.
With clean, aligned data in hand, you’re finally ready for the part most students think is the whole task: running the actual analysis.
Choosing the Right Analysis Method for Your Research Question
This is where your earlier one-sentence research question pays off, because it tells you directly which method you need instead of leaving you guessing between a dozen tools.
Overlay analysis combining multiple layers (soil, slope, land use, flood zones) to identify areas meeting several criteria at once; the default method for most suitability-mapping dissertations
Buffer analysis creating distance zones around features (schools, rivers, roads) to study proximity effects; common in accessibility and risk-exposure studies
Hotspot/cluster analysis identifying statistically significant clustering in point data (crime incidents, disease cases, informal settlements); needed when your question is about “where things concentrate,” not just “where things overlap”
Interpolation (IDW, Kriging) estimating values across continuous surfaces from scattered sample points, used for rainfall, pollution, or soil quality studies
Network analysis modelling movement along road or path networks, used in accessibility-to-services and evacuation-route studies
Match the method to the question, not the other way around. I’ve examined dissertations where a student ran impressive-looking hotspot analysis on data that needed simple overlay analysis instead the maps looked sophisticated and answered nothing the examiner actually asked about.
Once you’ve run the correct analysis, the real test begins because a map that only you understand is not a finished result.
Presenting Your GIS Results So Examiners Actually Understand Them
A shocking number of dissertations lose marks not because the analysis was wrong, but because the map presentation failed to communicate it. Every map in your dissertation needs: a clear title, a legend with properly labelled classes (not “Value 1, Value 2, Value 3”), a north arrow, a scale bar, and a data source citation in the caption. This is non-negotiable cartographic standard, and examiners notice its absence immediately.
Write a results narrative that walks the reader through what the map shows before you interpret it describe, then interpret, then discuss implications. Don’t make your examiner do the pattern-recognition work you were supposed to do for them.
Where possible, pair your spatial map with a simple supporting statistic or table percentage of study area falling into each suitability class, for instance. Examiners consistently respond better to a map backed by a number than a map alone, however visually impressive.
Export your final maps at print resolution (minimum 300 DPI) directly from your GIS software rather than screenshotting your screen. A pixelated, screenshotted map in a dissertation is one of the fastest ways to signal rushed work to an examiner, even when the underlying analysis was solid.
Good presentation gets your results understood. But before you even get to your viva, you still have to write the methodology chapter and this, more than anything else, is where students either sound like researchers or sound like they’re reciting a software manual.
Writing Your GIS Methodology Chapter Without Sounding Like a Manual
Your methodology chapter should read as a justified sequence of decisions, not a list of button clicks. For every method, state: why you chose it (tied back to your research question), what data it required, what assumptions or limitations it carries, and how you validated the output.
A sentence like “Overlay analysis was selected because it allows multiple suitability criteria slope, drainage proximity, and land use to be combined into a single composite suitability index, directly addressing the research question of optimal site identification” will score far better than “I used the overlay tool in QGIS to combine my layers.”
Always include a limitations paragraph data resolution constraints, time-lag in satellite imagery, or incomplete ground-truthing. Examiners respect honest acknowledgment of limitations far more than they respect a methodology that pretends to be flawless; a dissertation that claims perfect data in a region known for data gaps reads as naive, not strong.
With your chapter written and your maps presentable, there’s one more hurdle almost no online guide prepares you for: actually defending this work out loud, in front of people whose job is to find the hole in it.
Surviving Your Viva: The GIS Questions Examiners Actually Ask
In my experience sitting on both sides of this table, these are the questions that come up again and again, and you should have a clear, honest answer ready for each before you walk in:
- “Why did you choose this particular coordinate reference system / projection?”
- “How did you weight your criteria in the overlay analysis, and why those weights specifically?”
- “What would change in your results if this input dataset had been more recent or higher resolution?”
- “How did you validate that your output actually reflects ground reality?”
- “What are the practical, real-world implications of this suitability map for the actual people in that area?”
That last question is the one students prepare for least and need most your examiner wants to know your GIS analysis isn’t just a technical exercise, but something that connects to an actual decision someone could make.
Speaking of actual decisions this is exactly the bridge between what you’re doing for your dissertation and what I do for a living, so let me connect it properly rather than leave it hanging.
Where Your Dissertation GIS Skills and Real-World Planning Actually Meet
If your dissertation involves land use suitability, site selection, flood risk mapping, or accessibility analysis, you are doing at academic scale exactly what I do at MassodihPlans when I help a client choose and plan a small plot in a Nigerian city. The same overlay logic that identifies your “most suitable zone” in a dissertation chapter is the logic behind evaluating a real plot for drainage risk, soil suitability, and access before a single building plan is drawn.
This matters practically, not just as an interesting parallel: if your study area is in Nigeria and your dissertation touches land use, housing, or urban planning, the suitability criteria you’re mapping slope, drainage, soil, proximity to existing infrastructure are the same real-world factors that determine whether a specific small plot is actually buildable, and at what cost. Students doing planning-related dissertations have told me their fieldwork directly changed how they evaluated land for their own family’s future building project which is, honestly, the best possible outcome for academic work: it didn’t just earn a grade, it solved a real decision.
If that’s where your interest sits connecting spatial analysis to real building and planning decisions rather than leaving it in a thesis binder that’s the exact gap our Plan School content is built to close, and our Plans Library shows what well-suited site selection looks like translated into an actual building plan.
Common Mistakes That Cost Students Marks
- Running analysis before fixing CRS mismatches, producing results that look fine but are spatially wrong
- Choosing a sophisticated-sounding method because it’s impressive rather than because it answers the actual question
- Presenting maps without proper cartographic elements (legend, scale, north arrow, source)
- Writing methodology as a list of software steps instead of a justified sequence of research decisions
- Skipping a genuine limitations discussion, which reads to examiners as either naivety or overconfidence
- Leaving data sourcing undocumented, then struggling to answer provenance questions in the viva
One more thing make I add here, and I go talk am as I dey tell my students for class: no be because QGIS get plenty buttons means say na you sabi click all of them! Some students go dey click every tool for the toolbar like person wey dey press remote control wey no sabi which button dey do what meanwhile three correct tools for di job dey wait patiently. Know your three tools well-well pass knowing fifty tools anyhow.
A Simple Worked Example You Can Adapt
Say your dissertation question is: “Which areas of [your LGA/city] are most suitable for low-cost residential development, based on slope, drainage proximity, and distance to existing road network?”
- Source elevation data (SRTM, free) and derive a slope layer
- Source or digitize drainage lines from OSM or satellite imagery and create a buffer layer (e.g., 50m exclusion zone)
- Source or digitize the road network and create a proximity layer (closer to roads scored higher)
- Reclassify each layer on a common suitability scale (e.g., 1–5)
- Run a weighted overlay, assigning weights based on your literature review’s justification for each criterion’s relative importance
- Produce a final composite suitability map, validate against a handful of known sites, and discuss results
This exact structure slope, drainage, access is, not coincidentally, close to the real checklist I run through with clients before recommending whether a small urban plot is worth building on at all.
Frequently Asked Questions
Do I need ArcGIS, or is QGIS acceptable for a dissertation?
QGIS is entirely acceptable and widely used in published academic research. Use whichever software your data and supervisor support examiners assess your analytical reasoning, not your software license.
How much GIS experience do I need before starting my dissertation analysis?
Very little, if your research question is clearly framed first. Most dissertation-level analysis uses a small number of well-understood methods (overlay, buffer, basic interpolation) rather than advanced techniques clarity of question matters more than depth of software skill.
What if I can’t find good data for my study area?
This is common, especially in data-sparse regions. Combine free global datasets (satellite imagery, OSM) with your own fieldwork or GPS-collected points for the specific area, and document every source and its limitations honestly in your methodology.
How long does GIS analysis for a dissertation typically take?
Budget significantly more time for data sourcing and cleaning than for the analysis itself in most dissertations I’ve supervised, preparation takes two to three times longer than running the actual spatial operations.
Can GIS analysis alone be my entire dissertation methodology?
It can form a full quantitative methodology on its own, particularly for planning, geography, and environmental studies, but check your specific programme’s requirements some expect it paired with qualitative fieldwork or statistical validation.
Finally
GIS for a dissertation isn’t about mastering software it’s about asking a precise spatial question, choosing clean and well-documented data, applying the method that actually answers your question, and defending every decision you made along the way. Get the question right first, and the rest of this guide becomes a checklist instead of a mystery.
If your research or interest extends beyond the dissertation page into actually evaluating or planning real Nigerian land especially small urban plots our Services page outlines how we support that kind of site evaluation and design work directly, and our Homepage has more guides connecting planning research to real building decisions.
- How Do I Use GIS for My Project? A Practical Guide for Anyone Planning to Build on a Small Plot
- How Do I Determine Service Areas With GIS? Find Coverage Gaps Fast
- How Much of My Land Can I Build On? Plot Coverage Guide Nigeria
- What Setbacks Do I Need? Small Plot Setback Rules in Nigeria Explained
- How Long Does Planning Approval Take? Nigeria Approval Timelines Guide
Author
Massodih Okon is a Nigerian built-environment professional with academic and professional experience in urban and regional planning, geography, architectural design, Landscape Design, GIS and land development.
He holds a Master’s degree in Urban and Regional Planning from the University of Uyo and a first degree in Geography and Regional Planning.
Through MassodihPlans, he publishes practical guides on Nigerian house plans, building design, physical planning, site planning, development approval and residential construction. Read the full author profile →