Flood Risk Analysis, Flood Mapping and Mitigation Planning Services for Development
I want to start with something that actually happened, not a definition. A few years ago, a client showed me a plot he was about to pay for in full. On paper it looked fine dry, slightly elevated compared to the road, nothing unusual to the eye. What he hadn’t checked was where that plot sat relative to the natural drainage corridor two streets away, which had been quietly filled and built over during an earlier phase of development.
The plot itself wasn’t in a river’s path. But it was in the path of water that used to have somewhere else to go, and now didn’t. That’s the difference between looking at a piece of land and actually analysing its flood risk, and it’s the reason I’m writing this the way I am not as a listicle of flood terms, but as the conversation I’d actually have with you if you were sitting across from me with a site plan.
So let’s have that conversation properly.
The Terms Everyone Mixes Up (And Why That Matters to You)
Before anything else, we need to fix a vocabulary problem, because it isn’t just academic pedantry it changes what you actually do with the information.
Flood hazard
Is the physical event itself the water. It’s a description of what could happen: how deep the water could get, how fast it could arrive, how often it might occur, independent of anyone living there. A completely empty stretch of floodplain still has flood hazard.
Flood exposure
Is what’s actually sitting in the path of that hazard the people, buildings, roads, and infrastructure physically present in the hazard zone. Empty floodplain has hazard but no exposure. Build a housing estate on it, and exposure appears instantly, even though the hazard hasn’t changed at all.
Flood vulnerability
Is how badly that exposure gets hurt when the hazard shows up. Two identical houses can sit in identical hazard zones with identical exposure, and one survives with minor damage while the other is destroyed because of construction quality, elevation of the ground floor, drainage around the foundation, or how quickly people can evacuate. Vulnerability is about consequence, not just presence.
Flood susceptibility
Is a slightly different angle again it’s the land’s own physical tendency to flood, based on its terrain and drainage characteristics, independent of rainfall data or historic events. Susceptibility mapping asks “which parts of this landscape are naturally inclined to collect and hold water,” using terrain alone.
Floodplain
Is the specific, definable area of land adjacent to a river or drainage channel that gets inundated when that channel exceeds its capacity a term with actual hydrological and often legal meaning, not just “an area that sometimes floods.”
Flood risk
Is what you get when you combine hazard with exposure and vulnerability. This is the part almost every basic article gets wrong, so let’s slow down on it.
Risk Is Not the Same as Hazard And This Is Where Most Basic Content Gets It Wrong
Here’s a scenario I use with students when I teach this distinction, because it makes the point instantly: a remote floodplain along a river, with genuinely severe flood hazard deep, fast, frequent flooding but with zero buildings, zero roads, zero people. The hazard there is extreme. The risk is close to zero, because there’s nothing there to lose.
Now take a second scenario: a piece of land with only moderate flood hazard shallow, infrequent flooding but which happens to sit under a fully built residential estate with a primary school and a major access road. The hazard is modest. The risk is serious, because of what’s exposed and how vulnerable it is.
Risk = Hazard × Exposure × Vulnerability.
This matters practically because it tells you where your leverage actually is. You usually can’t change the hazard you can’t move a river or stop the rain. But you can absolutely change exposure (by choosing not to build in the worst zones, or by how densely you build) and vulnerability (through elevation, drainage design, and construction standards). A lot of flood mitigation conversation gets stuck arguing about hazard maps, when the actual decisions available to a developer or planner live in the exposure and vulnerability side of that equation.
When someone shows you a “flood risk” map, ask them directly whether it’s actually a hazard map with a different label. Genuinely huge numbers of maps circulating online and even in some official reports are hazard maps showing where water goes without any exposure or vulnerability layer added. That’s not wrong, but it’s incomplete, and it’s being sold as more than it is.
What Actually Goes Into a Proper Flood Risk Analysis
This is where we get into the factors a real analysis has to bring together. I’ll go through each one the way I’d actually explain its role, not just list it.
Elevation
Is your starting point literally, the height of the land above a reference datum. Lower-lying land collects water that higher land sheds. But elevation alone is a blunt instrument; two spots at the same elevation can behave completely differently depending on what surrounds them.
Slope
Tells you how fast water moves once it’s on the ground. Flat land holds water and lets it pond; steep land sheds it quickly but can also generate faster, more destructive flow downstream. Both extremes carry their own version of flood risk.
Drainage
The existing natural and constructed channels that carry water away is arguably the single most under-analysed factor in Nigerian development, because so much of it gets altered or blocked during construction without anyone mapping what it looked like before.
Rainfall
Data, ideally at a fine time resolution rather than just annual totals, tells you the intensity your drainage system actually has to cope with. A location can have modest annual rainfall and still flood badly because that rain arrives in short, intense bursts the drainage can’t absorb fast enough.
River proximity
Matters not just as a distance measurement but as a relationship how the river’s floodplain extends, and how far it has historically extended during major flood events, not just its current channel width.
Flow accumulation
Is a GIS-derived measure of how much water, in theory, ends up passing through any given point on the landscape based on everything upstream of it. This is one of the most powerful and least understood tools in flood analysis, because it reveals drainage patterns that aren’t obvious just from looking at a map or even standing on the site.
Land cover
Vegetation, bare soil, built-up area determines how much rainfall actually soaks in versus runs off. Forested or vegetated land absorbs significantly more water than bare or paved land.
Impervious surfaces
Roads, roofs, concrete, compacted earth are where land cover analysis becomes urgent for development specifically, because every square metre converted from vegetated ground to impervious surface adds directly to runoff volume and speed. This is the core mechanism behind why urbanization increases flood risk even where rainfall hasn’t changed at all.
Soil
Type and its infiltration capacity works alongside land cover sandy soils absorb water far better than heavy clay soils, which can leave water sitting on the surface even where the slope would otherwise let it drain.
Drainage density
The total length of drainage channels per unit area is a landscape-scale indicator of how efficiently a whole catchment can move water away. Low drainage density combined with high rainfall intensity is a recipe for standing water and flash flooding.
Historical flood locations
Are, frankly, some of the most valuable data you can get your hands on, because they represent what actually happened rather than what a model predicts should happen. Community knowledge, local government records, and satellite imagery of past events all belong in a serious analysis, not just terrain modelling.
Settlement density
Determines how many people and how much value sit inside a given hazard zone this is your exposure layer, discussed above.
Infrastructure exposure
Roads, power lines, water treatment facilities, schools, hospitals often matters more than residential exposure alone, because losing a single access road or substation can paralyze an entire area even if individual houses survive.
The GIS Workflow: How This Actually Gets Built
If you’ve ever wondered how all these factors actually get turned into the flood-risk maps you see in reports, here’s the real sequence, step by step, the way it’s actually done rather than the way it’s usually summarized in one sentence.
Step 1 Digital Elevation Model (DEM)
Everything starts here. A DEM is a grid of elevation values covering your study area, sourced from satellite data (like SRTM) or, for serious project-level work, from drone or LiDAR survey where higher resolution is needed. The quality of everything downstream depends on the resolution and accuracy of this starting layer.
Step 2 Hydrological correction. Raw DEMs almost always contain small errors pits and artificial depressions that don’t reflect real terrain. These get filled or corrected so water can theoretically flow continuously across the surface without getting artificially trapped in data noise.
Step 3 Flow direction
For every cell in the corrected DEM, the software calculates which direction water would flow, based on the steepest downhill path to a neighbouring cell.
Step 4 Flow accumulation. Building on flow direction, this step calculates how many upstream cells drain through each individual cell effectively revealing where water concentrates as it moves across the landscape, and highlighting natural stream and drainage paths that may not be obvious on the surface.
Step 5 Drainage network extraction
Cells with flow accumulation above a chosen threshold get classified as part of the drainage network, giving you a modelled stream and channel layer to compare against what actually exists on the ground (or used to, before it was built over).
Step 6 Terrain analysis
Slope, aspect, and curvature are derived from the DEM to understand not just where water flows but how fast and how it behaves at different points in the landscape.
Step 7 Land cover classification
Satellite imagery (commonly Landsat or Sentinel data) is classified into categories built-up, vegetation, bare soil, water to understand infiltration and runoff characteristics across the study area.
Step 8 Rainfall integration
Historical and, where available, real-time or forecast rainfall data is brought in as a separate layer, often requiring interpolation across the study area if rain gauge data is sparse.
Step 9 Proximity analysis
Distance from rivers, drainage channels, and known flood-prone points is calculated for every location in the study area, since risk generally increases with proximity to these features.
Step 10 Weighted overlay
This is where everything comes together. Each factor layer elevation, slope, drainage density, land cover, rainfall, proximity, soil is assigned a weight reflecting its relative influence on flood behaviour, based on either statistical analysis, expert judgement, or a combination of both (multi-criteria decision analysis is the formal term for this step).
Step 11 Flood-risk map output
The final overlay produces a classified map typically low, moderate, high, and very high risk zones which then gets validated, wherever possible, against historical flood records and, ideally, ground-truthed with a physical site visit.
Every one of these steps involves assumptions and simplifications the DEM resolution, the flow accumulation threshold, the weights chosen for the overlay. A flood-risk map is a model, not a photograph of reality. Anyone presenting one to you as pure, unquestionable fact either doesn’t understand the method or is hoping you won’t ask.
DEM → hydrology → flow direction → flow accumulation → drainage → terrain analysis → land cover → rainfall → proximity analysis → weighted overlay → flood-risk map
Beyond the Basic Map: Susceptibility, Hazard, Risk, and What They Actually Tell You Differently
Flood susceptibility mapping answers “where is the land itself naturally inclined to flood,” using terrain, soil, and drainage characteristics largely independent of specific rainfall scenarios. It’s your baseline the land’s inherent tendency.
Flood hazard mapping
Adds rainfall and hydrological modelling on top of susceptibility to answer “what would actually happen under a specific rainfall event” a 1-in-10-year storm versus a 1-in-100-year storm, for instance, each producing a different hazard footprint.
Flood-risk mapping
As covered above, layers exposure and vulnerability on top of hazard to answer the question that actually matters for a development decision: “what do we stand to lose, and how badly, if this hazard occurs.”
Historical flood analysis
Mapping documented past events serves as both a sanity check on the model above and, in its own right, a genuinely reliable predictor, since land that has flooded before very often floods again unless something structural has changed.
Future development risk
Analysis takes the current risk map and asks what happens if you change the land cover if that vegetated catchment upstream gets built over, if that natural retention area becomes a housing estate. This is where the 2026 research direction is genuinely moving the field forward: combining remote sensing, GIS, land-use change modelling, and flood-risk analysis together, rather than treating current conditions as fixed.
A recent 2026 study modelling land-use dynamics and flood risk across a major coastal Nigerian city used multi-decade satellite imagery to track how built-up area expanded while vegetation and water bodies shrank, and then projected forward to assess how that land-use trajectory would affect future flood exposure. The study found significant urbanization between 1984 and 2023, with built-up areas expanding substantially while forests and water bodies declined, reducing the natural flood-buffering capacity of the city. That’s precisely the point this section is making the risk on a site isn’t fixed by its current condition; it moves with what gets built around it, including what gets built after you’re already there.
Drainage Capacity, Natural Corridors, and the Infrastructure Layer Most People Never Check
Drainage capacity
Is simply whether the existing drainage system natural or engineered can physically carry the volume of water a given rainfall event generates. A drain sized for the rainfall and catchment conditions of twenty years ago is frequently undersized for both the rainfall intensity and the built-up catchment of today, and this mismatch is one of the single biggest drivers of urban flooding in growing Nigerian cities.
Natural drainage corridors
Are the paths water has always taken across a landscape, long before any development existed often barely visible as shallow depressions or seasonal streams that look, to an untrained eye, like ordinary land ready for building. Building directly on or across these corridors doesn’t make the water disappear. It just removes its path, and water without a path finds a new one, usually through whatever’s built in its way.
Retention areas
Are spaces natural or designed that temporarily hold stormwater and release it slowly, reducing the peak volume that hits downstream drainage all at once. Their loss during development is one of the clearest, most measurable causes of increased flood risk downstream, even when the development itself sits on relatively safe, elevated ground.
Green infrastructure
Vegetated swales, rain gardens, green roofs, urban tree cover works with the landscape’s natural absorption capacity instead of relying purely on pipes and channels to move water away. It’s increasingly treated as standard best practice rather than an aesthetic extra, because it reduces runoff volume at the source, before it ever reaches the drainage network.
Permeable surfaces
Permeable paving, gravel instead of solid concrete for driveways and parking areas let water infiltrate directly into the ground at the point it falls, rather than adding to surface runoff. This is one of the cheapest, most underused mitigation tools available at the individual plot level.
Detention and retention ponds
Are engineered features designed specifically to capture stormwater and release it gradually detention ponds typically drain completely between events, while retention ponds hold a permanent pool of water and use it as a buffer for incoming flow. Both are standard features in flood-conscious estate design elsewhere in the world and remain rare, though increasingly necessary, in Nigerian residential development.
Flood-safe site planning
Brings all of the above together at the individual project level: elevating ground floor levels above the assessed flood risk zone, orienting buildings and paving to work with natural drainage rather than against it, preserving rather than filling natural depressions and corridors, and incorporating retention or permeable elements into the site layout from the earliest design stage rather than as an afterthought once the layout is already fixed.
If you’re developing more than a single plot an estate, a subdivision, a commercial layout ask your designer directly whether the layout preserves or fills the site’s natural drainage corridors and retention areas. This one question, asked before the layout is finalized, prevents more downstream flooding than almost any amount of drainage engineering added afterward.
What a Flood-Risk Map Should NOT Be Used For
I want to be completely straight with you here, because this is the part that actually protects you, and it’s the part almost nobody writing about this topic is willing to say clearly.
A GIS-based flood-risk map however carefully built, however many factors it combines is not a legal flood certificate. If your transaction, insurance requirement, or regulatory approval needs a formal certified flood determination, that comes from the appropriate statutory authority through their own defined process, not from a GIS overlay analysis, however rigorous.
It is not a substitute for engineering design.
Knowing a site sits in a moderate-risk zone tells you that attention is needed it doesn’t tell you the exact foundation elevation, the specific drainage pipe sizing, or the precise flood-proofing detail your structural and civil engineers need to specify. That work still has to happen.
It is not a guarantee against flooding.
A “low risk” classification on a model is a probability statement based on available data and reasonable assumptions, not a promise. Rainfall extremes outside the historical record used to build the model, upstream development that changes drainage after your analysis was done, or simple model limitations can all produce flooding in an area classified as low risk.
And it is not a substitute for detailed hydrological and hydraulic modelling where the stakes genuinely justify it.
For a single residential plot, a well-built GIS risk analysis combined with sound site planning is usually proportionate. For a major estate, a commercial development, or anything near a significant watercourse, that GIS analysis should be the starting point that tells you detailed hydrological and hydraulic modelling the kind that actually simulates water depth, velocity, and timing under specific storm scenarios is warranted, not a replacement for it.
I say all of this because I’d rather you trust this article for being honest about its limits than trust it blindly and find out those limits the hard way, on your own site, after the money is spent. That kind of honesty is, in my experience, exactly what separates analysis you can actually build on from analysis that just looks impressive in a report.
Frequently Asked Questions
What’s the real difference between flood hazard and flood risk?
Hazard describes the physical event how the water behaves independent of what’s there. Risk combines that hazard with what’s actually exposed to it and how vulnerable that exposure is. A severe hazard with nothing exposed carries low risk; a moderate hazard with dense, vulnerable development carries high risk.
Can a GIS flood-risk map replace a proper flood survey before I build?
It shouldn’t be treated as a replacement it’s a strong starting screening tool that tells you where deeper investigation, detailed engineering, or hydraulic modelling is warranted. For anything beyond a single low-stakes plot, that follow-up investigation matters.
Why does building on my neighbour’s land increase flooding risk on mine?
Because drainage doesn’t respect plot boundaries it follows the terrain. Filling a natural drainage corridor or retention area upstream removes water’s existing path, and that water still has to go somewhere, often onto the nearest lower ground, which may well be your plot.
Is a plot with no history of flooding automatically safe?
Not necessarily. Historical flood-free status reflects past conditions, including past land use upstream and past rainfall patterns. If upstream development has changed since, or if a plot’s apparent safety came from a drainage corridor that has since been built over, past experience alone can be misleading.
What’s the single most useful mitigation step for an individual homeowner?
Preserving or working with your plot’s natural drainage path rather than filling or blocking it, combined with using permeable surfaces where possible instead of full concrete paving both are inexpensive relative to the flooding cost they help prevent.
Where This Leaves You
If there’s one thing I want you to walk away with, it’s this: flood risk isn’t a single number or a single colour on a map it’s the layered result of terrain, water, land cover, and what humans have built or removed from the landscape, combined with what’s actually sitting in harm’s way. Treating a flood-risk map as gospel is a mistake. Ignoring it entirely because “the plot looks fine” is a bigger one. The honest middle ground understanding what these maps genuinely tell you, and being equally clear about what they don’t is what actually protects a development, and the people who’ll live or work on it, long after the site plan is signed off.
Flood Risk Analysis as a Service: What You’re Actually Commissioning
Everything above explains how flood risk analysis works. This part answers the more practical question I get asked directly, once a client has read something like this: “Okay, but what exactly am I paying for if I bring this to you?” Here’s the honest answer, laid out the way I’d actually walk you through it.
What Problem Does This Service Solve?
At its core, this service answers one question you can’t safely guess at: is this land, or this layout, actually going to hold water now, and after everything around it keeps developing? Without it, you’re deciding where to put a foundation, a driveway, or an entire estate layout based on how the ground looks on a dry afternoon. That’s not a decision-making process; it’s a hope. Flood risk analysis replaces that hope with an actual read of elevation, drainage, rainfall behaviour, and what’s happening upstream of your plot, so the decision is based on something real.
Who Needs It?
Individual homeowners buying or building on a plot they haven’t fully vetted. Diaspora clients purchasing land remotely, who can’t physically walk the site themselves before committing funds. Developers planning an estate or subdivision, where one bad drainage decision at layout stage affects every single plot built afterward. Architects and engineers who need a defensible basis for site levels and drainage design rather than a guess. And local planning authorities or community groups trying to understand why a particular neighbourhood keeps flooding when nothing “obviously” wrong is visible on the surface.
When Should You Commission It?
Before you pay for land, ideally not after. Once money has changed hands, your options shrink to “how do I mitigate this” instead of “should I even buy this.” For a development or estate layout, it belongs at the concept stage, before roads, plot boundaries, and drainage lines are fixed on paper, because retrofitting drainage corridors into an already-finalized layout is far more expensive than designing around them from the start. And if you already own the land and are simply planning to build, commission it before your architect finalizes floor levels and drainage details the analysis should inform their design, not correct it afterward.
The cheapest time to commission this is always before you’re emotionally and financially committed to the plot. Once you’ve paid, the analysis can only tell you how to cope not whether to walk away.
What Information Do We Need From You?
A survey plan or coordinates of the plot, at minimum. Any historical knowledge you or neighbours have about flooding in the area this local knowledge is often more valuable than people realize. Your intended use of the land (single house, estate, commercial development), since the scale of analysis should match the scale of the decision. Any existing soil test or geotechnical report, if you already have one. And, where available, information on planned or ongoing development in the surrounding area, since upstream changes affect your site’s risk even when your own plot hasn’t changed at all.
How the Analysis Is Actually Carried Out
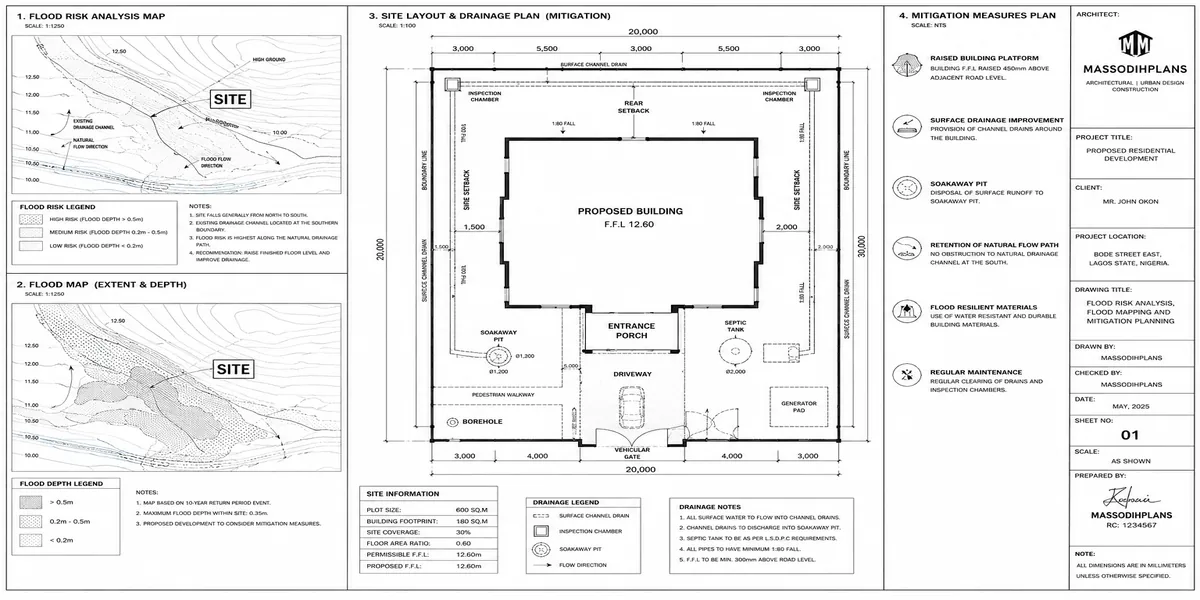
We start with the elevation and terrain data for your specific site and its surrounding catchment, not just the plot boundary in isolation flood risk is never just about your fence line. And we map drainage patterns, both the official/constructed drainage and the natural corridors that existed before development, since the second category is the one most often missed. We layer in rainfall data, land cover, and soil characteristics as described earlier in this guide, and we cross-check everything against any historical flood information we can gather for the area. Where the project scale justifies it, we also assess what upstream land-use changes could do to your site’s risk over the coming years, not just its condition today. The output is validated against real-world knowledge wherever possible, not treated as a pure model output taken on faith.
What You Actually Receive
A clear risk classification for your site low, moderate, high, or very high explained in plain language, not just handed to you as a coloured map with no interpretation. The specific factors driving that classification for your plot (is it elevation, proximity to a natural corridor, drainage density, something else). Practical recommendations: whether the plot is suitable as-is, what mitigation would be needed, or whether it’s a site to avoid entirely. And, where relevant, guidance on floor level elevation, drainage layout principles, and site planning adjustments for your architect or engineer to work from.
What Decisions This Deliverable Actually Supports
Whether to buy the land at all. Where, within a larger plot or layout, to place buildings versus open or retention space. What floor level to build to. Whether additional drainage infrastructure or retention features are needed before construction, not after the first flood. And, for developers, how to lay out roads, plots, and green space so the development works with the site’s natural drainage instead of fighting it for the next fifty years.
Common Mistakes People Make
Commissioning this after the land is already paid for, when its main value is in the buy/don’t-buy decision. Treating a single dry-season site visit as equivalent to a proper analysis. Assuming a neighbouring plot’s flood history doesn’t apply to yours, when they may share the exact same drainage corridor. And commissioning analysis for an individual house but skipping it entirely for a larger estate layout, where the stakes and consequences of a bad drainage decision are far higher.
What Can Go Wrong If You Skip This Entirely?
You build on, or block, a natural drainage corridor without realizing it exists and years later, water that used to pass through now backs up into your own compound or your neighbour’s. You set a floor level too low for the site’s actual flood behaviour, and every rainy season becomes a maintenance and anxiety cycle. For developers, an entire estate gets laid out around roads and plots that fight the natural drainage pattern, and the flooding complaints start arriving within the first rainy season after handover — at which point fixing it means tearing up already-built infrastructure.
Example
A client once asked me to review a fairly large plot outside an urban core before final purchase. The site itself sat on reasonably elevated ground. But tracing the flow accumulation pattern showed the plot sat directly downstream of a shallow natural depression that had recently been filled and built over by another developer upslope. Water that used to spread harmlessly across that depression now had one remaining path straight toward my client’s plot. We didn’t tell him the land was unbuildable; we told him exactly where on the plot to build, where to leave space for a retention feature, and what floor elevation to use. That’s the difference this kind of analysis actually makes not a blanket “yes or no,” but a specific, usable answer.
Limitations and Professional Boundaries
This service tells you what the land and drainage patterns indicate, based on the best available data and sound method it is not a legal flood certificate, not a substitute for detailed hydrological or hydraulic modelling on high-stakes projects, and not a guarantee against flooding under conditions beyond what the data and model can reasonably capture. Where a project’s scale or risk profile justifies it, we’ll tell you directly when you need deeper hydraulic modelling or a licensed hydrologist’s input, rather than stretching this service beyond what it can responsibly claim.
Ready to Get This Done Properly?
Don’t Wait for the Water to Answer This Question for You
Every flood-damaged property I’ve assessed had one thing in common: someone assumed their site was “probably fine” before construction started. By the time the water proves them wrong, the cost isn’t just repairs it’s a foundation that was never designed for the site’s real drainage behaviour, a plot that’s harder to insure, and in some cases, a building sitting on land the next flood season could make unusable.
Flood risk is not something you can eyeball from a site visit or guess from how your neighbours’ compounds have behaved so far. It requires proper flood mapping and mitigation planning, done before your foundation design is finalized, not after your walls are already up.
If you are planning a development residential, estate, or commercial and haven’t had a professional flood risk analysis done for that specific plot, this is the point in your project where that decision either saves you money or costs you far more later.
Talk to me before you break ground. Reach out through the Services page today to book a Flood Risk Analysis, Flood Mapping, or Mitigation Planning consultation for your project.
- Land Suitability Analysis and GIS Site Selection for Development Projects
- GIS, Land Use Change Analysis and Digital Mapping for Planning and Growth
- Site Plan Analysis and Layout Planning for Land Development and Building
- Architectural Design and Drafting for House Plans, Building Plans and 3D
- 15 Things to Check Around a Plot Before Buying Land in Nigeria Safely Today
- How GIS Can Help Identify Flood-Prone Areas Before You Build in Nigeria
- Site Analysis Checklist: 50+ Things to Check Before Building on Your Land
- What Is a Master Plan and Why Does Every Growing Community Need One?
Author
Massodih Okon is a Nigerian built-environment professional with academic and professional experience in urban and regional planning, geography, architectural design, Landscape Design, GIS and land development.
He holds a Master’s degree in Urban and Regional Planning from the University of Uyo and a first degree in Geography and Regional Planning.
Through MassodihPlans, he publishes practical guides on Nigerian house plans, building design, physical planning, site planning, development approval and residential construction. Read the full author profile →