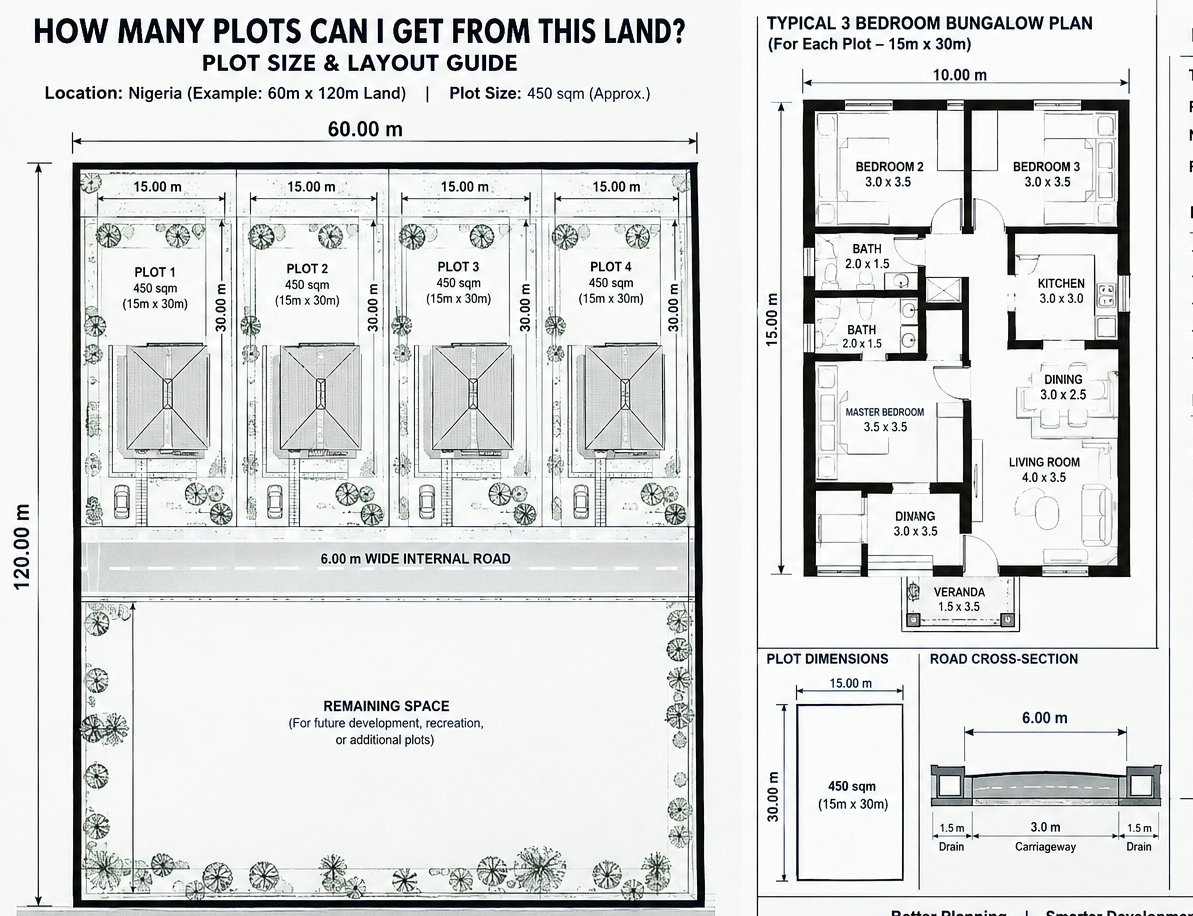
How many plots can you get from 2 hectares of land
How many plots can you get from 2 hectares of land? The answer depends on your plot size, road layout, drainage, setbacks, and the land required for other infrastructure. Two hectares equal 20,000 square metres. If you use a common Nigerian plot size of 450 square metres (15 m × 30 m), the theoretical calculation gives you approximately 44 plots. However, you cannot assume that all 44 plots will be available for sale because roads, drainage channels, access routes, and other layout requirements will reduce the usable land area. In practice, the number of plots you can obtain may be significantly lower, depending on the site conditions and proposed layout.
A client called me three weeks ago with a question I have answered more times than I can count: “Massodih, I just bought 2 hectares in Akpabuyo. How many plots can I get out of it?” Before giving him a number, I asked, “How many plots do you think you should get?” He confidently said 40. I explained that his final yield would depend on the plot dimensions and road layout, and that a poorly planned subdivision could cost him several saleable plots. He did not believe me until I showed him the calculations on paper.
If you are a developer, landowner, or someone planning to subdivide family land into saleable plots, understanding this calculation is essential. It can determine whether your project delivers the expected returns or loses money through poor planning. In this guide, I will explain how to calculate plot yield, compare different plot sizes, account for roads and infrastructure, and estimate how many plots your land can realistically accommodate before committing money to subdivision.
Why “Plots per Hectare” Is Never a Simple Division
Here’s the mistake almost every first-time land developer makes: they take their land size, divide it by the plot size they want to sell, and announce a number. 2 hectares (20,000 sqm) divided by a standard 648 sqm plot “should” give 30.8 plots. That number is wrong, and it’s wrong in a predictable, calculable way because raw land is not the same thing as saleable land.
Before a single plot can be sold, a chunk of your gross land area has to be given up to things that don’t generate direct revenue but make the estate functional and legally approvable: roads, drainage channels, open/recreational space, and service plots (transformer, water tank, waste collection point). What’s left after all of that is your net developable area, and that not your gross land size is what actually gets divided into saleable plots.
This is the gap between what a landowner expects and what a developer delivers, and it’s the single biggest source of disputes I see between land-owning families and the developers they partner with. So let’s close that gap with real numbers.
The Core Formula: From Gross Land to Net Saleable Plots
Here is the actual formula, the one I use on every layout design before a single plot boundary gets drawn:
N = ⌊ (GLA × (1 − d)) / Ap ⌋
Where:
- N = Net saleable plots (your final answer)
- GLA = Gross Land Area (your total land size, in square metres)
- d = Total deduction ratio (roads + drainage + open space + services + contingency, expressed as a decimal)
- Ap = Standard plot size you intend to sell (in square metres)
- ⌊ ⌋ = “round down” because a partial plot isn’t a saleable plot
That single formula answers the question you came here with. Everything else in this article is about getting an honest, defensible value for d, because that’s the number most people guess wrong usually by guessing too low.
Never quote a plot count to a client, investor, or family member before you’ve nailed down your deduction ratio with an actual layout sketch. A verbal estimate given before the layout exists is the single most common cause of “but you promised us 40 plots” disputes I get called in to mediate.
Breaking Down the Deduction Ratio (d): Where Your Land Actually Goes
This is the part no article on this topic breaks down properly. Let’s go through each component, because each one behaves differently depending on your land size, shape, and the standards your approving authority enforces.
1. Roads and Circulation (typically 20–30% of GLA)
Every plot needs legal, physical road access this is non-negotiable for approval in Nigeria and almost everywhere else. Road allowance depends on your layout pattern:
- A simple grid layout with one access road is the most land-efficient, typically consuming 18–22% of gross land
- A loop road layout (common in gated mini-estates) typically consumes 22–28%
- A cul-de-sac layout, despite looking efficient on paper, often consumes 25–32% once you account for turning circles and the extra road length needed to reach interior plots
2. Drainage and Easements (typically 5–10% of GLA)
Stormwater has to go somewhere, and in Nigeria’s rainfall pattern, this is not optional infrastructure it’s the difference between an estate that survives its first rainy season and one that floods every June. Drainage easements along roads and at natural water flow points typically consume 5–8% of gross land, rising toward 10% on low-lying or waterlogged sites that need wider channels.
3. Open Space and Recreational Area (typically 5–10% of GLA)
Most planning authorities require a minimum percentage of land set aside for open/green space, even on a modest residential layout. This isn’t wasted land from a sales perspective either a well-placed small park or green buffer genuinely increases the resale value of the plots surrounding it, which is worth remembering when a client pushes back on “why are we giving up land for a park nobody asked for.”
4. Services and Utility Plots (typically 2–5% of GLA)
Transformer plot, water tank/borehole plot, waste collection point, and sometimes a small security post or gatehouse plot. These are small individually but add up, and they’re the deduction most frequently forgotten in rough estimates which is exactly why rough estimates run high.
5. Shape and Access Contingency (typically 3–8% of GLA)
This is the deduction nobody talks about, and it’s often the difference between my estimate and a client’s hopeful one. Irregularly shaped land, corner cuts at road junctions, and the unavoidable small wastage pockets created wherever plot boundaries meet road curves all eat into your net area. A perfectly rectangular, regular plot of land might only need 3–4% contingency; an oddly shaped parcel with multiple boundary angles can need 7–8%.
Add these together, and here’s what you get in practice:
| Deduction Category | Low Estimate | Typical Estimate | High Estimate |
|---|---|---|---|
| Roads and circulation | 18% | 24% | 32% |
| Drainage and easements | 5% | 7% | 10% |
| Open/recreational space | 5% | 7% | 10% |
| Services and utility plots | 2% | 3% | 5% |
| Shape/access contingency | 3% | 5% | 8% |
| Total deduction ratio (d) | 33% | 46% | 65% |
Notice how wide that range is. This is exactly why one developer gets 30 plots from 2 hectares and another gets 20 from the same size land they’re not disagreeing about the math, they’re working with genuinely different deduction ratios based on layout choices and land shape.
Now that you can see where the land actually goes, let’s put real numbers through the formula so you can check your own project against it.
Worked Example: 2 Hectares, Step by Step
Let’s use my client’s actual Akpabuyo land as the example, since it’s the scenario that prompted this whole article.
Given:
- GLA = 2 hectares = 20,000 sqm
- Total deduction ratio (d) = 38% (a realistic mid-range figure for a loop-road layout on reasonably regular land, including contingency) = 0.38
- Desired plot size (Ap) = 648 sqm (a common 60ft x 100ft equivalent)
Step 1 — Find the net developable area:
Net Developable Area = GLA × (1 − d) = 20,000 × (1 − 0.38) = 20,000 × 0.62 = 12,400 sqm
Second Step 2 — Divide by plot size:
N = 12,400 / 648 = 19.1
Step 3 — Round down:
N = 19 net saleable plots
That’s a long way from the 40 he was hoping for, and it’s also noticeably below the “simple division” guess of 30.8 that ignores deductions entirely. When I walked him through this formula on paper, the conversation shifted immediately from disappointment to planning because now he had a real number to build a sales and pricing strategy around, instead of a hopeful guess that would have collapsed the moment his surveyor submitted the layout for approval.
Any plot count you calculate before an approved layout plan exists is an estimate, not a guarantee. Your state’s planning authority has the final say on road width minimums, drainage requirements, and open space percentages always validate your deduction ratio against your specific local authority’s current requirements before you price or market a single plot.
Quick-Reference Table: Net Plots by Land Size and Plot Size
Here’s a table I built for exactly this conversation using a realistic 40% total deduction ratio, which sits comfortably in the middle of the range above and works well as a planning-stage estimate before your layout is finalized.
| Gross Land Size | Net Developable Area (60% of GLA) | 450 sqm plots | 500 sqm plots | 600 sqm plots | 648 sqm plots | 900 sqm plots |
|---|---|---|---|---|---|---|
| 1 acre (4,047 sqm) | 2,428 sqm | 5 | 4 | 4 | 3 | 2 |
| 1 hectare (10,000 sqm) | 6,000 sqm | 13 | 12 | 10 | 9 | 6 |
| 2 hectares (20,000 sqm) | 12,000 sqm | 26 | 24 | 20 | 18 | 13 |
| 5 hectares (50,000 sqm) | 30,000 sqm | 66 | 60 | 50 | 46 | 33 |
| 10 hectares (100,000 sqm) | 60,000 sqm | 133 | 120 | 100 | 92 | 66 |
Keep in mind this table assumes a 40% deduction ratio applied uniformly your actual number will shift with your specific road layout, drainage needs, and land shape, which is exactly why the formula above matters more than any table ever will. Use this to sanity-check a developer’s pitch, not to replace an actual layout design.
The Plot Yield Ratio: Measuring How Efficiently You’re Using Your Land
Beyond “how many plots,” serious developers track a second number that tells them how efficiently their layout is performing:
PYR = (N × Ap) / GLA × 100
This is your Plot Yield Ratio — the percentage of your gross land that actually converts into saleable product. In the Akpabuyo example: (19 × 648) / 20,000 × 100 = 61.6%.
As a benchmark: a PYR in the 55–65% range is typical and healthy for a standard residential layout. Below 50% usually signals an inefficient road pattern, excessive open space allocation, or genuinely difficult land shape. Above 70% should make you suspicious it often means drainage, road width, or open space has been under-provided to inflate the plot count, which is exactly the kind of shortcut that gets a layout rejected at approval stage or causes flooding and access problems after the estate is built.
When a developer or agent quotes you a plot count for land you’re considering buying into, ask for their Plot Yield Ratio, not just the plot number. A PYR above 70% on a flat, regular piece of land is a red flag worth investigating before you commit money.
Quick Conversions People Actually Search For
Since this question comes in many forms, here are the conversions I get asked for most, using the standard 40% deduction benchmark from the table above:
How many plots in 1 acre (Nigeria)? Roughly 3–5 net plots, depending on plot size 1 acre is 4,047 sqm, smaller than most people assume when they picture “an acre of land.”
How many plots in 1 hectare? Roughly 9–13 net plots, again depending on plot size chosen.
How many 648sqm plots in 2 hectares? Approximately 18, as shown in the worked example above.
How many plots in 100ft x 100ft (929 sqm) land? This single parcel is typically only large enough for 1 plot once you account for any required access allowance it’s a single-plot size, not a subdivision candidate.
If your land is below roughly 1,500–2,000 sqm, you’re almost always looking at a single-plot or two-plot scenario rather than a true subdivision project the deduction formula above becomes less relevant below that threshold, because roads and drainage infrastructure don’t scale down proportionally on very small parcels.
Road Layout Choice: The Decision That Moves Your Plot Count the Most
Since roads are consistently the largest single deduction, your road layout pattern is the highest-leverage decision you’ll make before your plot count is finalized.
Grid layout most land-efficient, works best on regular, rectangular land, and is the easiest pattern for future road maintenance and utility routing
Loop layout a good middle ground for mini-estates, providing controlled single-entry access (valued for security) at a moderate land cost
Cul-de-sac clusters popular for the premium, low-traffic feel they create, but genuinely the least land-efficient pattern once turning circles and dead-end road length are accounted for
If maximizing plot count is your primary commercial goal, a grid or modified-grid layout on regular land will consistently outperform a cul-de-sac layout by several percentage points of Plot Yield Ratio often the difference between 2 and 4 extra plots on a 2-hectare parcel, which at typical plot prices is real money left on the table for the sake of an aesthetic preference.
How This Connects Back to Small-Plot Planning (And Why It Matters Even If You’re Not Subdividing Land)
Here’s the thread that ties this whole calculation back to what MassodihPlans actually exists to help you with: designing houses and layouts that work on small, real-world Nigerian plots. Understanding this deduction math isn’t just for developers slicing up hectares it directly affects you if you’re an individual buyer evaluating a plot inside someone else’s subdivided estate.
When you buy a plot inside a newly subdivided layout, the deduction ratio the developer used tells you a lot about what you’re actually getting: a layout with a healthy, honest deduction ratio means proper road width, functioning drainage, and genuine open space around your future home not a flood-prone plot squeezed in at the end of an undersized cul-de-sac to hit a sales target. The same space-planning discipline we apply to designing a house that works beautifully on a small 450 or 500 sqm plot is the discipline that should have gone into the layout your plot sits inside, before you ever broke ground.
Before buying a subdivided plot, ask to see the approved layout plan not just a sales brochure and check the road width reaching your specific plot, the nearest drainage channel, and whether your plot’s frontage meets your state’s minimum standard. A plot that looks fine on a sales map can still sit on a layout with an unrealistically low deduction ratio that will cause real problems once the estate is fully built and occupied.
How This Translates Internationally
If you’re reading this from outside Nigeria, the formula doesn’t change only the typical deduction percentages and the regulatory names do, since land subdivision math is universal even where the rules differ.
United States subdivision ordinances typically mandate road dedication plus park/open-space contributions, commonly totalling 20–30% of gross land depending on municipality
United Kingdom local planning authorities often require higher amenity and open-space standards, frequently pushing total deductions toward 30–35%
Germany Bebauungsplan (binding land-use plans) are typically strict on road width, green space ratios, and setback requirements, often resulting in deduction ratios in the 35–40% range
UAE master-planned communities (Dubai, Abu Dhabi) commonly allocate significant land to wide roads, landscaping, and shared amenities, often exceeding 35% depending on community tier
Switzerland, Luxembourg, Austria strict zoning and green-space requirements typically push deductions toward the higher end, often 35–45%
Iceland low-density planning norms with generous road reserves for climate resilience (snow clearance margins) tend toward 30–35% deductions
Qatar large-scale planned developments commonly follow deduction patterns similar to UAE, in the 30–35% range
Canada, Australia municipal/council subdivision bylaws typically require 20–30% for roads and public reserve land, varying significantly by province/state and lot size
Singapore URA (Urban Redevelopment Authority) master planning operates at a much higher density and regulatory precision than typical residential subdivision, with deduction logic embedded in planning parameters rather than a simple percentage
Wherever you’re developing or buying, the underlying question is the same: ask what percentage of gross land becomes net saleable or buildable area under your local rules, then run it through the same formula above.
Frequently Asked Questions
How many plots can I get from 1 plot of land?
If your land is already a single standard plot (450–900 sqm depending on local standard), it typically isn’t large enough to subdivide further once access and setback requirements are applied it’s a one-house parcel, not a subdivision candidate.
Is there a standard deduction percentage every developer uses?
No. The honest range runs from roughly 33% to 65% of gross land, depending on road layout, drainage needs, open space requirements, and land shape which is exactly why this article gives you the formula rather than a single fixed number.
Can I increase my plot count by reducing road width?
Only within your approving authority’s minimum legal road width reducing below that minimum risks outright rejection of your layout plan, and even where technically allowed, substandard road width causes real access and emergency-vehicle problems after the estate is occupied.
Why did my surveyor’s plot count differ from my own rough calculation?
Almost always because your rough calculation used simple division (gross land ÷ plot size) instead of accounting for roads, drainage, open space, and services the deduction ratio explained throughout this article.
Does land shape really affect plot count that much?
Yes. A perfectly rectangular, regular parcel can achieve a noticeably higher Plot Yield Ratio than an oddly shaped parcel of the identical gross size, because irregular boundaries create unavoidable small wastage pockets wherever plot lines meet the road layout.
Finally
The honest answer to “how many plots can I get from this land” was never a single number it’s a formula, and now you have it: net developable area divided by your chosen plot size, after an honest accounting of roads, drainage, open space, and services. Run your own land through it before you make promises to investors, family members, or buyers, and you’ll avoid the exact conversation I had with my client in Akpabuyo three weeks ago the one where hope meets arithmetic, and arithmetic always wins.
If you’re sitting on land right now and need this calculation done properly with an actual layout plan, not just an estimate this is precisely the kind of project our Services page covers, from gross-to-net yield analysis through full estate layout design and approval documentation. If you’re planning to build on a smaller individual plot rather than subdivide, browse our Plans Library for house designs genuinely optimized for small Nigerian plot sizes, or visit Plan School to understand plot dimensions, setbacks, and layout reading before you commit to any land. You can also explore more land, layout, and planning guides on our Homepage.
- Can I Build a Church or Mosque on This Land? Check Nigeria’s Rules
- How Do I Check a Property Before I Build? 7 Checks to Avoid Costly Errors
- How Do I Compare Two Properties? Size, Value & Land Checks in Nigeria?
- How Do I Produce GIS Maps for My Project? A Practical Mapping Guide
- How Do I Do GIS Analysis for My Dissertation? A Practical GIS Guide
- How Do I Do Land-Use Change Analysis? GIS Methods for Site Planning
Author
Massodih Okon is a Nigerian built-environment professional with academic and professional experience in urban and regional planning, geography, architectural design, Landscape Design, GIS and land development.
He holds a Master’s degree in Urban and Regional Planning from the University of Uyo and a first degree in Geography and Regional Planning.
Through MassodihPlans, he publishes practical guides on Nigerian house plans, building design, physical planning, site planning, development approval and residential construction. Read the full author profile →