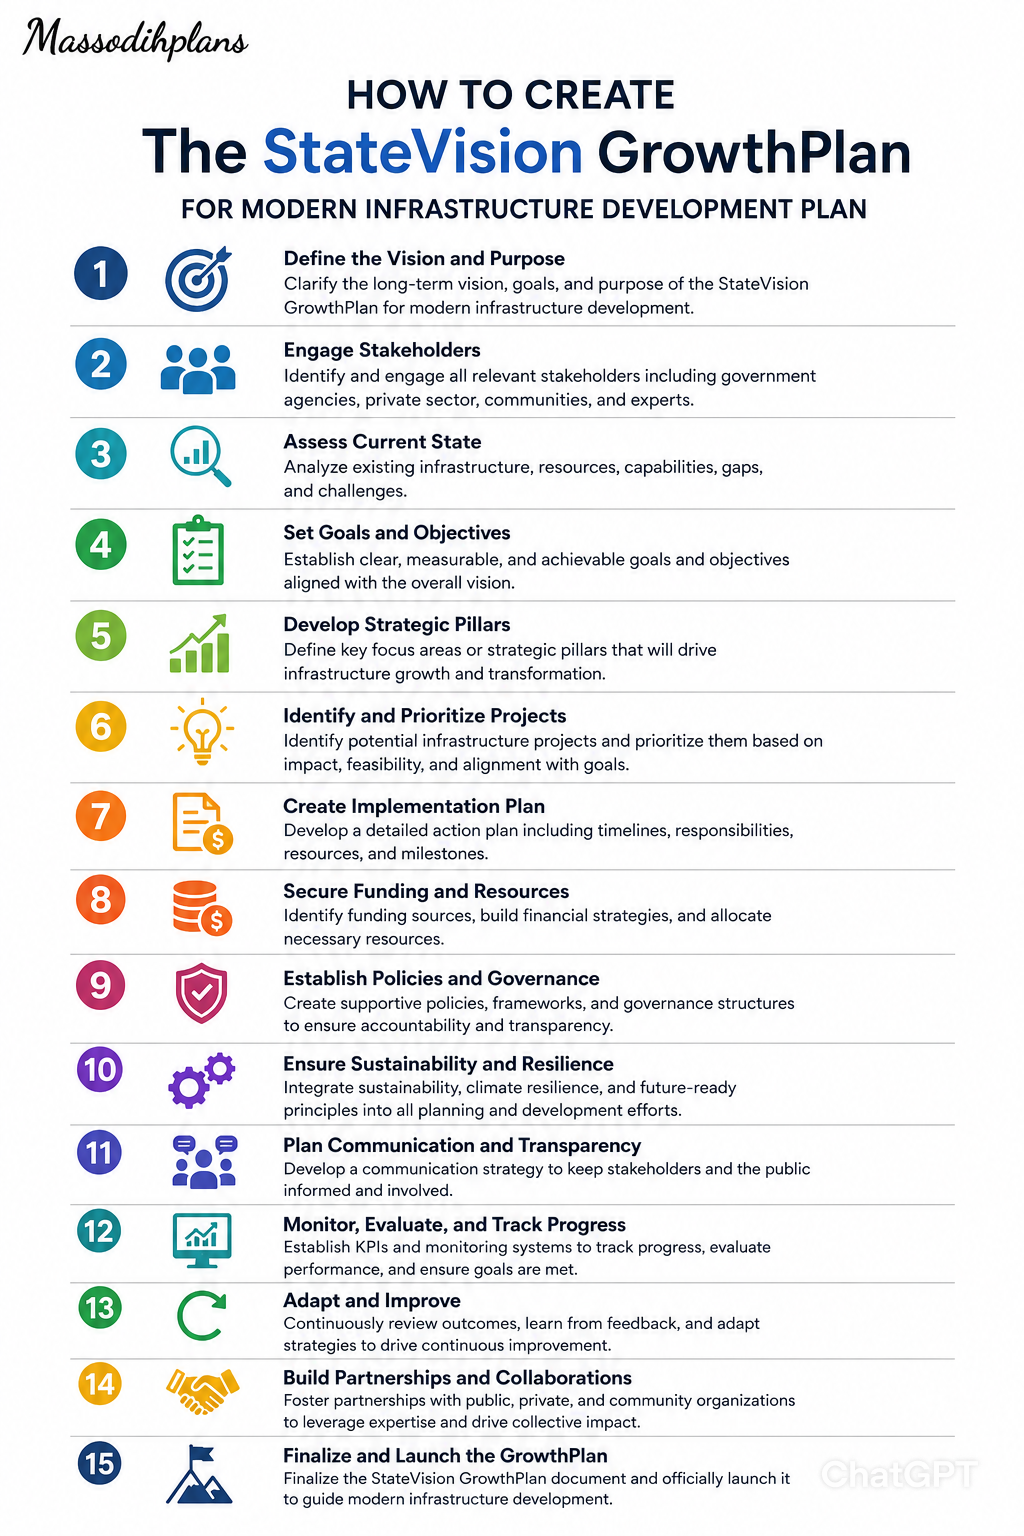
The Proposed StateVision GrowthPlan for Modern Infrastructure Development
Every city that is thriving today was once a blank piece of land with a plan behind it. Every city that is failing today was once a blank piece of land with no plan or worse, a plan that was never implemented. The StateVision GrowthPlan is a structured physical development framework designed to change that story entirely. It answers the urgent questions that governments, developers, planners, and landowners ask every day: Where do people live? How do roads connect communities? Where does water go during heavy rains? How do institutions serve growing populations? And how do we build in phases without destroying long-term potential?
I want to walk you through this planning framework the way a senior consultant would walk a client through a site briefing clearly, practically, and honestly. Whether you are a town planning student preparing your first studio project, a real estate investor evaluating land, a government official overseeing physical development, or a developer trying to understand what a master plan actually contains, this article gives you the depth you need.
By the time you finish reading, you will understand how the StateVision GrowthPlan works from site analysis through zoning, circulation, drainage, infrastructure coordination, and development phasing and why getting any of these elements wrong costs communities decades of missed potential.
What the StateVision GrowthPlan Actually Is
The StateVision GrowthPlan is a long-range physical development plan that coordinates land use, infrastructure, transportation, environmental management, and urban growth strategy across a defined planning area. It is not a vague vision document. The StateVision GrowthPlan for Modern Infrastructure Development assigns functions to every land parcel, hierarchies to every road, capacities to every drainage channel, and timelines to every development phase through precise spatial drawing, calculation, zoning, and phasing.
In practical terms, the GrowthPlan does four things simultaneously:
- It defines what activities happen where, through land use planning and zoning.
- It defines how people and goods move, through circulation system design.
- It defines how infrastructure serves the population, through utilities, drainage, and services planning.
- It defines how growth unfolds over time, through phased development strategy.
That four-part structure is what separates a genuine master plan from a concept sketch.
Understanding Land Use Distribution in the GrowthPlan
Land use planning is the foundation of every master plan. The GrowthPlan assigns specific functional categories to every portion of the planning area, and each category is color-coded on the official land use map so that any planner, official, or developer can read the plan at a glance.
Here is the land use color coding standard used in modern physical development plans:
| Land Use Category | Color Code |
|---|---|
| Residential activities | Yellow |
| Commercial, shopping, or business activities | Red |
| Industrial and manufacturing activities | Purple |
| Institutional and public infrastructure uses | Blue |
| Transportation and circulation systems | Gray |
| Mass assembly and civic gathering spaces | Dark Slate Gray |
| Recreational and leisure uses | Light Green |
| Natural resource and ecological conservation | Forest Green |
| Undeveloped or unclassified land | White |
This color coding is not decorative. In a physical planning studio environment, these colors do serious work. They allow rapid visual analysis of land use proportions, help identify imbalances between residential supply and service provision, and make zoning conflicts immediately visible.
Land Use Proportion Guidelines
A well-balanced master plan in a developing urban environment typically allocates land in roughly the following proportions:
- Residential zones: 40 to 55 percent of total developable land
- Commercial zones: 5 to 15 percent
- Institutional zones: 8 to 12 percent (schools, health centers, administrative buildings)
- Open space and recreation: 10 to 15 percent
- Circulation and roads: 15 to 20 percent
- Industrial zones: 3 to 8 percent (where applicable)
- Environmental reserve: 5 to 10 percent (buffers, drainage corridors, ecological zones)
These proportions shift based on population projections, economic base, topography, and development intent. A commercial hub plan will allocate significantly more land to mixed-use commercial zones. A residential estate plan will push residential allocation toward 60 percent. The GrowthPlan calibrates these ratios based on site-specific data.
Zoning Hierarchy and Development Control
Zoning is the legal and spatial mechanism by which the GrowthPlan controls what can be built where. It is not simply about separating uses, it is about defining the density, height, setback, plot coverage, and character of every zone.
The Four-Level Zoning Hierarchy
Primary Zoning establishes the broad functional category for each area: residential, commercial, industrial, or institutional.
Secondary Zoning refines those broad categories into specific subzones. For example, within a residential primary zone, you may have low-density residential (R1), medium-density residential (R2), and mixed residential-commercial (R3). Each subzone has its own development standards.
Overlay Zoning applies additional controls on top of primary and secondary zoning. Flood overlay zones restrict development in flood-prone areas. Heritage overlay zones protect historical structures. Environmental overlay zones limit clearing and grading near ecological corridors.
Special Purpose Zones cover areas that do not fit neatly into standard categories transit-oriented development nodes, urban renewal areas, or special economic zones.
Development Standards by Zone
Every zone in the GrowthPlan carries binding development standards. These include:
- Plot coverage ratio: The maximum percentage of a plot that can be covered by structures. Typical values are 50 to 60 percent for residential, 60 to 70 percent for commercial.
- Floor Area Ratio (FAR): The total floor area of all structures divided by the plot area. An FAR of 1.5 means a 600 sqm plot can accommodate 900 sqm of total floor space across all floors.
- Building height limits: Expressed in floors or metres. Low-density zones typically limit buildings to one or two floors. Commercial cores may allow six to twelve floors.
- Setbacks: Minimum distances between structures and plot boundaries (discussed in detail below).
Expert Planning Note: In many African and developing-country contexts, zoning standards exist on paper but are poorly enforced on the ground. The GrowthPlan addresses this by building development control checkpoints into the phasing framework and by designating planning officers responsible for on-site compliance verification at each phase boundary.
Road Hierarchy and Circulation Systems
A master plan’s circulation system is its skeleton. The GrowthPlan designs roads not just as movement corridors but as organizers of urban space, determinants of land value, and frameworks for utility delivery.
The Five-Level Road Hierarchy
Primary Arterial Roads form the main movement spine of the planning area. They carry high volumes of traffic at relatively high speeds and connect the planning area to regional networks. Typical right-of-way width: 30 to 50 metres. Pedestrians are typically separated from vehicle lanes on these roads.
Secondary Arterial Roads distribute traffic from the primary arterial network into major neighborhoods. They balance movement capacity with local access. Right-of-way: 20 to 30 metres.
Collector Roads gather traffic from residential streets and feed it to arterial roads. These roads often carry neighborhood commercial activity. Right-of-way: 15 to 20 metres.
Local Access Roads serve individual plots and residential clusters. They prioritize access over movement speed. Right-of-way: 9 to 12 metres.
Pedestrian Paths and Cycle Lanes form a non-motorized network that the GrowthPlan integrates with the road hierarchy. These routes connect residential areas to schools, markets, green spaces, and transit stops at a human scale.
Road Right-of-Way Breakdown
The right-of-way of a road is the total land corridor reserved for that road, including carriageway, shoulders, drains, footpaths, and utility corridors.
| Road Type | Total ROW | Carriageway | Footpath | Drain | Setback |
|---|---|---|---|---|---|
| Primary Arterial | 40 m | 18–24 m | 3 m each side | 1.5 m each | 6 m each |
| Secondary Arterial | 25 m | 12–15 m | 2 m each side | 1.0 m each | 4 m each |
| Collector Road | 18 m | 9–12 m | 1.5 m each | 0.75 m each | 3 m |
| Local Road | 9–12 m | 6–7.5 m | 1.0 m each | 0.5 m each | 2 m |
These dimensions are drawn precisely on the circulation plan, which forms one of the core technical drawings of the GrowthPlan.
Common Mistakes in Circulation Planning
Town planning students and junior consultants often make the following errors in their studio projects:
- Designing all roads at the same width, creating a grid with no hierarchy
- Placing primary arterial roads too close to residential plot boundaries without adequate setbacks
- Failing to provide pedestrian connectivity between neighborhoods, forcing all movement onto vehicle roads
- Not accounting for turning radius at intersections, which becomes critical for buses, trucks, and emergency vehicles
- Ignoring the relationship between road gradient and drainage direction
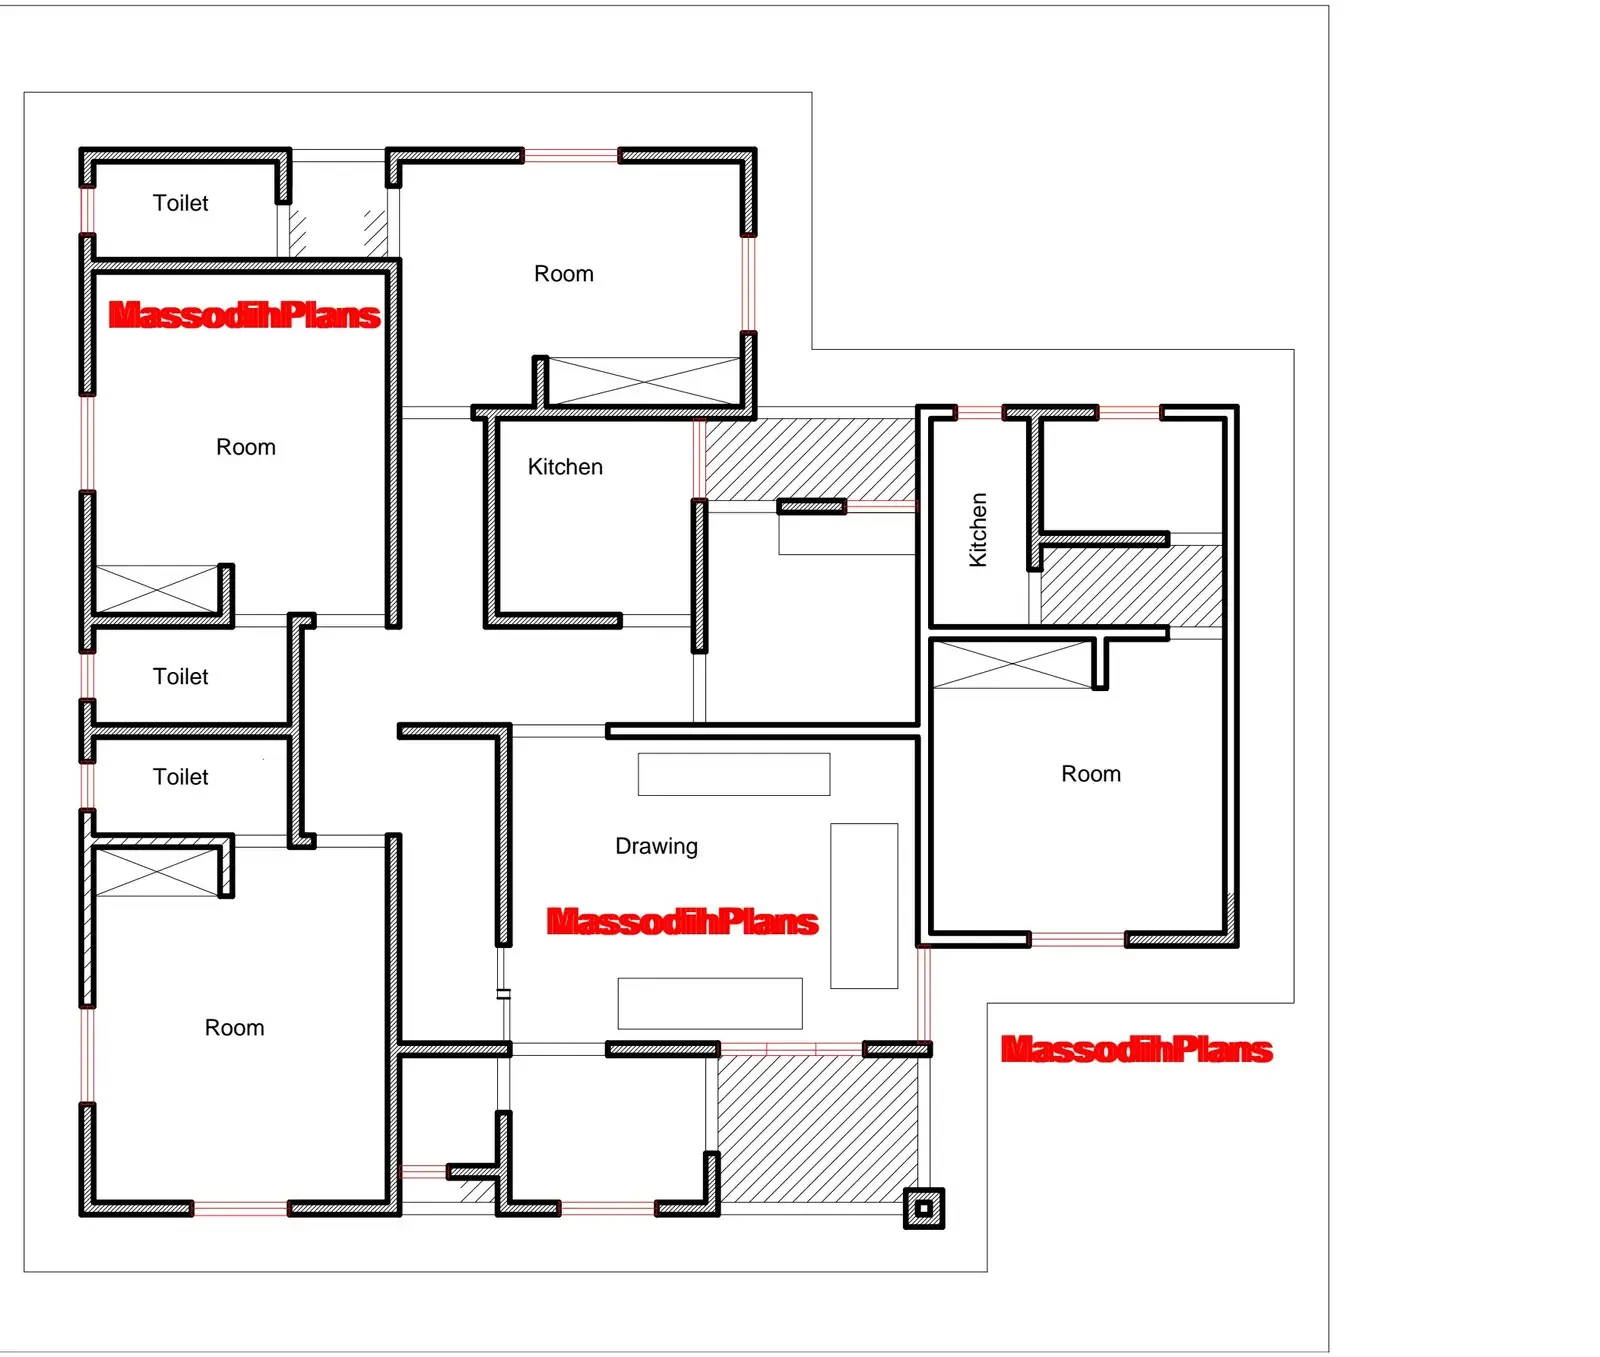
Plot Arrangements and Residential Layout Design
Within residential zones, the GrowthPlan defines how individual plots are arranged, dimensioned, and accessed. This is where physical planning becomes most tangible for landowners and developers.
Plot Size Standards
Plot sizes vary by zone and income level. The GrowthPlan typically defines:
- High-density residential plots: 150 to 300 sqm
- Medium-density residential plots: 300 to 600 sqm
- Low-density residential plots: 600 to 1500 sqm
- Mixed-use plots: 400 to 1000 sqm depending on commercial intensity
In fast-growing urban areas across Africa and Asia, compact plot development is increasingly common. A 300 sqm plot, properly designed, can accommodate a family residence, a workspace, and a small rental unit generating income for the owner while adding density to the neighborhood without strain on infrastructure.
Setback Requirements
Setbacks are the minimum distances that must be maintained between any structure and the boundaries of its plot. They serve multiple functions: they provide fire breaks between buildings, allow daylight penetration, create ventilation corridors, accommodate drainage, and preserve street character.
Standard setback requirements in the GrowthPlan:
| Zone | Front Setback | Rear Setback | Side Setbacks |
|---|---|---|---|
| Low-density residential | 6 m | 4 m | 2.5 m each |
| Medium-density residential | 4.5 m | 3 m | 1.5 m each |
| High-density residential | 3 m | 2 m | 1.0 m each |
| Commercial | 5 m | 2 m | 0 to 1.5 m |
| Industrial | 10 m | 6 m | 4 m each |
Front setbacks are particularly important because they determine the visual character of streetscapes and provide space for planting, parking, or service access. Rear setbacks often contain utility easements.
Planning Mistake to Avoid: Many developers in developing countries build right to the plot boundary to maximize floor area. This violates setback requirements, blocks drainage, creates fire hazards, denies neighbors daylight, and makes future utility maintenance impossible. The GrowthPlan’s development control framework specifically targets this violation with pre-construction approval requirements.
Open Space Allocation and Public Realm Design
Open spaces are not wasted land. They are the breathing infrastructure of urban areas and the GrowthPlan takes them seriously.
Types of Open Space in the GrowthPlan
Neighborhood Parks and Playgrounds are located within residential clusters so that no household is more than 400 metres from a recreational green space. Minimum plot allocation: 0.3 to 0.5 hectares per 500 residents.
Community Green Corridors follow drainage channels and utility easements, converting infrastructure corridors into usable green space. These serve both ecological and recreational functions.
Central Public Squares and Civic Plazas anchor commercial or institutional zones. They provide gathering space, identity, and social infrastructure for the broader community.
Ecological Reserve Areas protect sensitive environmental features: wetlands, stream banks, steep slopes, and high-value vegetation from development. These are shown on the plan in forest green and are subject to the strictest overlay zone controls.
Open Space Calculation
The standard planning ratio is a minimum of 10 percent of gross developable area allocated to open space. In urban heat island mitigation contexts, 15 percent is recommended. For a 100-hectare planning area, that means a minimum of 10 to 15 hectares of dedicated open space distributed across the site.
Physical Planning Standards: The Technical Foundation
Physical planning standards are the precise numerical rules that govern every aspect of the built environment. They are derived from national building codes, urban planning regulations, engineering standards, and international best practice.
Here are the core standards that inform the StateVision GrowthPlan:
Residential density standards:
- Low-density: 10 to 20 dwelling units per hectare
- Medium-density: 20 to 50 dwelling units per hectare
- High-density: 50 to 150 dwelling units per hectare
School catchment standards:
- One primary school per 2,500 to 5,000 residents, within 800 metres walking distance
- One secondary school per 10,000 to 15,000 residents, within 2 kilometres
Health facility standards:
- Primary health centre: one per 5,000 residents within 1.5 kilometres
- General hospital: one per 50,000 to 100,000 residents within the planning district
Commercial intensity standards:
- Neighbourhood commercial node: serves 3,000 to 8,000 residents within 500 metres
- District commercial centre: serves 20,000 to 50,000 residents within 2 kilometres
These standards are not arbitrary. They emerge from decades of population health research, transportation modeling, and urban design analysis. They are the minimum thresholds below which a community begins to experience service deficits that damage quality of life and economic productivity.
Infrastructure Planning: Utilities, Water, Power, and Waste
Infrastructure is what transforms a zoned plan into a functioning community. The GrowthPlan’s infrastructure layer coordinates the delivery of water supply, electricity, telecommunications, solid waste management, and wastewater treatment across the planning area.
Water Supply System
The GrowthPlan designates water supply infrastructure at three levels:
- Trunk mains: Primary water transmission pipes that carry treated water from the source or treatment facility into the planning area. Typically 300 mm to 600 mm diameter.
- Distribution mains: Secondary pipes that carry water through neighborhoods. Typically 150 mm to 300 mm.
- Service connections: Tertiary pipes that connect individual plots to the distribution network. Typically 25 mm to 75 mm.
Water pressure requirements, reservoir location, and pump station placement are all determined during the infrastructure planning phase. In many parts of sub-Saharan Africa and South Asia, the primary challenge is not system design but power supply reliability pump stations require stable electricity. The GrowthPlan addresses this by designating backup power infrastructure at critical utility nodes.
Electricity Distribution
The GrowthPlan locates electrical substations, transformer stations, and distribution routes as part of the utilities overlay. Substations are positioned to minimize transmission distances and to serve defined load zones. Underground cabling is increasingly preferred in new planned developments to reduce theft, storm damage, and visual clutter.
Solid Waste Management
Waste management planning in the GrowthPlan designates:
- Collection points at neighborhood scale (every 200 to 500 metres in residential areas)
- Transfer stations at the sub-district level
- Landfill or waste treatment facility access routes clearly separated from residential corridors
In many African cities, waste management is one of the most visible planning failures. Secondary roads become informal dump sites because formal collection infrastructure was never planned. The GrowthPlan’s waste management layer prevents this by integrating collection infrastructure into the layout design from the start.
Telecommunications Infrastructure
Modern master plans include telecommunications corridors dedicated underground conduit networks that house fibre optic cables, digital infrastructure, and telecommunications equipment. The GrowthPlan designates these corridors along road rights-of-way, ensuring that smart city infrastructure can be deployed without retrofitting existing roads.
Drainage Systems and Flood Control
Drainage is where most developing-country urban plans fail catastrophically. I have reviewed planning areas where billions in infrastructure investment was undermined entirely by inadequate drainage design. The GrowthPlan addresses drainage with the seriousness it deserves.
The Drainage Hierarchy
Primary Drains (Major Channels): These are the main channels that receive water from the entire planning area and discharge it into natural watercourses or retention systems. They are engineered structures, typically 2 to 5 metres wide, with designed slopes, lined channels, and overflow management features.
Secondary Drains (Neighborhood Channels): These collect water from collector roads and local streets and convey it to primary channels. Typical width: 0.75 to 1.5 metres.
Tertiary Drains (Plot-Level): These are roadside drains and plot drainage connections that collect surface runoff from individual plots and roads. Typical width: 0.3 to 0.6 metres.
Flood Control Considerations
Flood control in the GrowthPlan goes beyond pipe sizing. It involves:
Catchment analysis: The planning area’s total catchment area is mapped using GIS and topographic data. Rainfall intensity data for the local region, expressed as return period rainfall events, determines design flows. The GrowthPlan typically designs for a 1-in-25-year rainfall event for tertiary drains and a 1-in-100-year event for primary channels.
Retention ponds and detention basins: Rather than conveying all stormwater rapidly out of the site, the GrowthPlan often incorporates retention ponds that hold peak flow volumes and release them gradually. These ponds also serve as recreational open spaces in dry periods.
Flood overlay zoning: Areas within flood plains or below calculated flood levels are designated as ecological reserve or recreational zones in the GrowthPlan, not residential or commercial zones. This prevents the catastrophic loss of life and property that occurs when flood plains are developed without controls.
Permeability standards: The GrowthPlan requires that a defined minimum percentage of each plot remains permeable, covered by grass, gravel, or permeable paving to allow rainfall infiltration rather than runoff concentration.
Field Observation: In fast-growing Nigerian, Ghanaian, and Kenyan urban areas, the most common drainage failure is developers who block roadside drains during construction and never restore them. The GrowthPlan’s implementation layer requires drainage restoration certification before any occupation permit is issued.
Environmental Management and Climate Responsiveness
Urban development changes the environment. The GrowthPlan’s environmental management layer anticipates those changes and integrates mitigation and adaptation strategies from the planning stage.
Urban Heat Island Management
Dense urban areas can be 3 to 5 degrees Celsius warmer than surrounding rural areas due to the urban heat island effect. The GrowthPlan counters this through:
- Street tree planting programs: Minimum one tree per 8 metres of road frontage on collector and arterial roads
- Green roof and wall requirements: In commercial and institutional zones, green infrastructure standards apply to buildings above a defined floor area
- Reflective surface standards: Light-colored paving materials in high-solar-gain areas
- Urban forest reserves: Ecological corridors that bring vegetation into the core of the planning area
Environmental Impact Assessment Integration
Before the GrowthPlan is finalized, an Environmental Impact Assessment identifies the development’s expected effects on air quality, water quality, ecology, noise, and soil. The GrowthPlan’s land use and infrastructure design is then adjusted to minimize negative impacts.
Climate-Responsive Site Planning
The GrowthPlan orients building zones to take advantage of prevailing winds, positions ecological corridors to function as ventilation channels, and designs road alignments to minimize solar heat loading on major east-west pedestrian routes.
GIS Integration and Mapping in the GrowthPlan
The StateVision GrowthPlan is developed using Geographic Information Systems tools that allow planners to analyze, visualize, and integrate multiple layers of spatial data simultaneously.
Core GIS Data Layers Used in the GrowthPlan
- Topographic data: Digital elevation models derived from satellite or drone surveys that define slopes, drainage patterns, and buildable land
- Land cover mapping: Identifies existing vegetation, water bodies, settlements, and agricultural land
- Cadastral mapping: Plots existing land ownership boundaries and parcels
- Infrastructure network mapping: Existing roads, utility lines, and service facilities
- Population distribution mapping: Spatial distribution of existing population across the planning area
- Flood risk mapping: Areas at risk of inundation based on rainfall and topographic analysis
- Land use suitability analysis: Overlay analysis that combines slope, soil type, flood risk, and proximity to existing services to identify optimal locations for each land use category
Platforms commonly used include QGIS (open-source and highly capable), ArcGIS (industry standard), and Google Earth Engine for large-scale land cover analysis. For students beginning their GIS journey, QGIS is the most accessible starting point, and the UN-Habitat Urban Planning and Design Lab offers excellent reference frameworks for applying GIS to master plan preparation.
For further learning on GIS-based planning workflows, visit the Plan School section of MassodihPlans where practical tutorials walk through land use analysis, zoning mapping, and circulation design using real planning data.
How GIS Improves Plan Accuracy
Transportation Integration and Smart Mobility
A master plan that addresses only roads but ignores transportation is incomplete. The StateVision GrowthPlan integrates a full mobility strategy that anticipates how people actually move — on foot, by motorcycle, by minibus, by private car, and eventually by mass transit.
Mobility Demand Analysis
The GrowthPlan estimates travel demand at full buildout by combining population projections with land use distribution data. This produces an origin-destination matrix a spatial dataset that shows where residents will travel from and to for work, education, commerce, and services. The circulation system is then designed to accommodate those travel patterns efficiently.
Transit Corridor Designation
The GrowthPlan reserves dedicated transit corridors along primary and secondary arterial roads. These corridors are wide enough to accommodate formal bus rapid transit or rail infrastructure in future development phases, even if only minibus services operate in early phases. Reserving these corridors now costs nothing. Retrofitting them later — after buildings have been constructed within the right-of-way — costs enormous amounts of money and political capital.
Walkability and Non-Motorized Transport
The 15-minute neighborhood concept the idea that daily needs should be accessible within 15 minutes on foot or by bicycle is a core organizing principle of the StateVision GrowthPlan. Land use mix, pedestrian network design, and service distribution are all calibrated to minimize the need for motorized trips for everyday activities.
Population Projections and Growth Strategy
The GrowthPlan is not designed for today’s population. It is designed for a projected population at a defined planning horizon typically 10, 20, or 25 years from the base year.
Population Projection Methods
Three projection methods are typically used in combination:
- Cohort-component projection: Accounts for age-specific fertility, mortality, and migration rates to project population by age cohort over time.
- Trend extrapolation: Applies historical growth rates (typically from census data) to project future population.
- Structural demand projection: Estimates population based on the planned number of residential plots, assuming defined household sizes.
For a planning area designed to accommodate 50,000 residents at buildout with an average household size of 4.5 persons, the structural demand method projects 11,111 residential plots. This number then drives land allocation, infrastructure sizing, and service facility requirements.
Urban Growth Boundary
The GrowthPlan establishes an Urban Growth Boundary, a spatial limit that prohibits development beyond the planning horizon. This boundary prevents uncontrolled sprawl, protects agricultural and ecological land, concentrates infrastructure investment, and maintains manageable population density within the serviced area.
Land speculation often pressures planning authorities to expand this boundary prematurely. The GrowthPlan’s phasing framework addresses this pressure through a structured process. Authorities can release additional land for development only after defined triggers are met, typically when 75 to 80 percent of the current phase has been built out and infrastructure capacity has been confirmed.
Development Phasing and Implementation Framework
A master plan without a phasing strategy is a wish list. The StateVision GrowthPlan structures development into logical phases that coordinate infrastructure delivery, land release, population growth, and investment sequencing.
Typical Three-Phase Structure
Phase One (Years 1 to 5): Foundation Development
- Primary road network construction and servicing
- Main drainage channels and retention facilities
- Trunk water supply and primary electrical distribution
- Anchor institutional facilities (school, primary health centre, administrative hub)
- Release of 25 to 30 percent of residential plots in the highest-priority residential zone
- Commercial node establishment near the entry point
And Phase Two (Years 5 to 15): Consolidation and Growth
- Secondary road network completion
- Neighborhood commercial nodes activated
- Additional residential zones opened based on Phase One uptake
- Secondary schools and expanded health facilities
- Recreation facilities and green corridors developed
- Industrial or light manufacturing zone activated if economically viable
<strong>Phase Three (Years 15 to 25): Maturity and Intensification
- Full infrastructure network in place
- Urban densification along transit corridors
- Mixed-use intensification in commercial zones
- Urban renewal of any informal settlements that emerged during earlier phases
- Long-term maintenance frameworks activated for aging infrastructure
For practical implementation templates and phasing documentation tools, explore the MassodihPlans Plans Library for downloadable planning resources.
Planning Approval Processes
Understanding planning approval matters just as much as understanding plan design. The GrowthPlan operates within a governance framework, and no plan regardless of technical quality moves into implementation without passing through that framework.
The Typical Planning Approval Pathway
- Site assessment and feasibility study: The developer or planning authority commissions a site assessment and feasibility study before preparing the master plan.
- Concept plan submission: The project team submits a broad land use and circulation concept to the relevant planning authority for initial review and comments.
- Environmental Impact Assessment: A registered environmental consultant prepares the Environmental Impact Assessment and submits it alongside or shortly after the concept plan.
- Draft Master Plan submission: The project team submits the complete GrowthPlan document, including all technical drawings, reports, and land use schedules, for technical review.
- Public participation: Planning authorities in many jurisdictions require affected communities to review and comment on the plan through a formal public participation process.
- Technical committee review: A multi agency technical committee reviews the plan against national standards, infrastructure capacity, and policy frameworks.
- Planning authority approval: The planning authority grants final approval, often with attached conditions.
- Development control registration: The planning authority registers the approved plan as the official development control instrument for the planning area, making its zoning and standards legally binding.
Planning Approval Bottlenecks in Developing Countries
In many African, South Asian, and Southeast Asian contexts, the approval process suffers from:
- Understaffed planning agencies with excessive workloads
- Overlapping jurisdictions between local, state, and federal authorities
- Informal systems where approvals are delayed without unofficial facilitation
- Inconsistent application of standards by different reviewing officers
- Land title disputes that halt planning processes mid-stream
The GrowthPlan mitigates some of these risks by front-loading community engagement and multi-agency consultation before formal submission, reducing the likelihood of late-stage objections and revisions.
Mixed-Use Integration and Investment Value
One of the most significant planning shifts of the past two decades is the embrace of mixed-use development as both a planning principle and an investment strategy. The StateVision GrowthPlan incorporates mixed-use zones at strategic nodes throughout the planning area.
Why Mixed Use Works
Mixed-use development activates ground floors with commercial and retail activity while placing residential, office, or institutional uses on upper floors. The benefits are multiple:
- Walkability: Residents can access services without motorized transport.
- Economic activity: Ground-level commercial uses generate employment close to residents.
- Land efficiency: A single plot generates multiple income streams.
- Infrastructure efficiency: One set of utilities serves multiple uses, improving cost-per-user ratios.
- Urban vitality: Active street frontages create safer, more engaging urban environments.
Investment Attractiveness of Mixed-Use Nodes
Mixed-use plots in well-planned urban areas consistently appreciate faster than single-use residential plots. When a planning area has a credible implementation record, commercial operators compete for mixed-use plot frontage. This drives land values upward benefiting both the original developer and the planning authority’s land value capture mechanisms.
For investors and developers evaluating entry into a StateVision GrowthPlan area, the mixed-use node locations are the highest-value early entry points.
If you are evaluating land investment in a planned development area, the MassodihPlans Services page provides access to professional planning consultation, site evaluation, and investment feasibility support.
Common Planning Failures the GrowthPlan Addresses
These are the failures I see repeated across developing-country urban areas. Planners can prevent them. Governments pay heavily for them. The StateVision GrowthPlan exists to stop them.
Informal settlement encroachment:
Developers often leave planned development areas vacant for too long without physical demarcation. Informal settlers then occupy land reserved for roads, green spaces, and service facilities. The GrowthPlan prevents this problem through phased land release, which reduces large unoccupied areas that attract informal occupation.
Drainage collapse:
Contractors frequently build secondary and tertiary drains without engineering specifications, fill them with construction waste, block them through encroachment, or fail to connect them to primary drainage channels. The GrowthPlan makes drainage continuity a mandatory condition for plot release in every development phase.
Traffic gridlock from poor road design: Collector roads that dead-end without connectivity to the arterial network create massive congestion problems as populations grow. The GrowthPlan’s circulation design ensures redundant connectivity — multiple routes between any two points in the planning area.
Power infrastructure overload: New estates frequently connect to existing electrical networks without upgrading transformer capacity. The result is chronic power failures that reduce quality of life and depress land values. The GrowthPlan designates dedicated transformer stations sized for full buildout demand.
Waste management failure: As noted earlier, without designated collection infrastructure, waste management defaults to informal dumping on road shoulders and open spaces. The GrowthPlan’s waste management layer prevents this from day one.
Land speculation and plot hoarding: When developers hold large portions of planned land without development activity, planned communities fail to consolidate and infrastructure becomes uneconomical to deliver. The GrowthPlan addresses this through development timelines embedded in plot sale conditions, requiring development commencement within a defined period of allocation.
Smart Growth Economics and Long-Term Sustainability
The StateVision GrowthPlan is not just a spatial framework, it is an economic development strategy. Smart growth principles ensure that the planning area generates increasing land values, attracts sustained investment, and maintains livability over decades without chronic infrastructure deterioration.
How Infrastructure Drives Land Value
Every confirmed infrastructure commitment in a planned area creates a land value uplift in surrounding plots. A confirmed primary road alignment raises adjacent land values. And a confirmed school location drives residential demand nearby. A confirmed commercial node attracts business investment that further raises surrounding values.
The GrowthPlan sequences infrastructure delivery to maximize these value creation effects beginning with spine infrastructure that generates the broadest value uplift, then proceeding to neighborhood-level services that unlock residential demand.
Sustainability Mechanisms
Long-term sustainability requires that the planning area generate sufficient revenue to maintain its own infrastructure. The GrowthPlan’s financial model typically integrates:
- Development levies: Charges applied to plot allocations that fund infrastructure delivery
- Property rates: Recurring revenue from developed plots that funds maintenance
- Commercial revenue: Ground rents from commercial plot leases that contribute to maintenance reserves
- Land value capture: A portion of land value appreciation is returned to the planning authority through betterment levies or plot price mechanisms
When these mechanisms are properly calibrated, the GrowthPlan area becomes financially self-sustaining within 10 to 15 years of initial development freeing government capital for other priorities.
Community Functionality and Human Experience
A master plan that works on paper but fails human beings is a failed plan. The StateVision GrowthPlan incorporates community functionality as a design requirement, not an afterthought.
Family Lifestyle Integration
The residential layout design ensures that children can walk safely to school without crossing arterial roads. It provides shaded pedestrian connections to markets and community centers. It designs play areas within sight of residential clusters so parents can supervise children from within their plots.
Elderly residents are considered in gradient design steep slopes are avoided in residential areas wherever topography allows, and where unavoidable, ramps and level rest areas are incorporated into pedestrian paths.
Neighborhood Identity
Each residential precinct in the GrowthPlan is designed with a defined center a small square, a community facility, a commercial node that gives residents a reference point and a gathering space. This spatial identity is a social infrastructure investment. Communities that have physical centers develop stronger social cohesion, which in turn supports safer neighborhoods and more effective collective maintenance of shared infrastructure.
Practical Field Observations for Planning Students and Interns
If you are a student preparing your first studio project or a young planner working on your first real assignment, here are the things your textbook probably did not tell you:
- The site always has surprises. No matter how good your GIS data is, site visits reveal overlooked details such as informal footpaths that now serve as roads, seasonal drainage channels missing from topographic maps, and unregistered existing structures.
- Stakeholder conflict is normal. Landowners, community leaders, government officials, and developers will often have conflicting visions for the same land. Your job as a planner is not to choose sides but to design a framework that accommodates legitimate interests while protecting public welfare.
- Infrastructure costs determine plan viability. A beautiful land use plan is meaningless if the cost of servicing it exceeds what the market or government can pay. Always run a rough infrastructure costing exercise before finalizing your layout.
- Plans are implemented by people, not agencies. The quality of implementation depends on the competence and integrity of the individuals responsible for development control, inspection, and enforcement. The GrowthPlan must be designed with realistic assumptions about implementation capacity.
- Drainage is always underestimated. Budget more for drainage than you think you need. Scope it more conservatively than your calculations suggest. The consequences of getting drainage wrong are catastrophic and very expensive to correct.
Future Expansion and Planning Flexibility
The StateVision GrowthPlan designates future expansion zones beyond the current urban growth boundary and reserves them for development in future planning phases. The plan maps these zones and protects them from incompatible development through forward planning controls.
The GrowthPlan incorporates flexibility at multiple levels:
• Mixed use zones can adjust the commercial to residential balance as market conditions change
• Industrial zones can transition into logistics, creative industries, or mixed use commercial areas if industrial demand does not emerge
• Transit corridors can support different transit technologies based on financial and operational feasibility
• Institutional reserves can shift to alternative public uses if population distribution changes.
FAQs
Q: What is the StateVision GrowthPlan in physical planning?
A: The StateVision GrowthPlan is a long-range physical development framework that coordinates land use allocation, road hierarchy, infrastructure delivery, drainage systems, zoning standards, and phased development across a defined planning area. It is the master planning instrument that guides physical development from raw land to a functional urban community.
Q: How is land use color coded in a master plan?
A: Standard planning practice assigns specific colors to each land use category. The plan shows residential zones in yellow, commercial zones in red, industrial zones in purple, institutional zones in blue, transportation corridors in gray, civic assembly areas in dark slate gray, recreation areas in light green, ecological conservation areas in forest green, and undeveloped land in white. These colors allow rapid visual reading of any zoning map.
Q: What are the standard road setbacks in a master plan?
A: Setbacks vary by road classification. Primary arterial roads typically have building setbacks of 6 metres from the road boundary. Secondary arterials require 4-metre setbacks. Collector roads require 3 metres. Local access roads require 2 metres. These setbacks are measured from the edge of the road right-of-way, not the carriageway.
Q: How does GIS improve master plan preparation?
A: GIS allows planners to integrate multiple spatial data layers topography, existing infrastructure, land ownership, flood risk, vegetation cover, and population distribution into a single analytical environment. This produces more accurate land use suitability assessments, more precise drainage designs, and more defensible zoning decisions than manual mapping methods.
Q: What is the typical planning horizon for a master plan?
A: Most master plans use a 20 to 25 year planning horizon from the base year. Planners calibrate population projections, infrastructure sizing, and land allocation to the projected population at the horizon date. Authorities typically review and update the plan every 5 to 10 years to reflect actual development rates and changing conditions.
Q: How does the StateVision GrowthPlan handle flood risks?
A: The StateVision GrowthPlan manages flood risk through catchment analysis with GIS and topographic data, designs a three tier drainage hierarchy for defined rainfall return periods, designates flood prone areas as ecological reserves or recreational zones, provides retention ponds for peak flow attenuation, and enforces permeability requirements on individual plots to reduce surface runoff concentration.
Q: What is the purpose of development phasing in a master plan?
A: Development phasing coordinates the timing of infrastructure delivery, land release, and population growth so that communities develop in an orderly way without infrastructure deficits or uncontrolled sprawl. It also prevents land speculation by attaching development timelines to plot allocations.
Q: How does mixed-use zoning benefit investors?
A: Mixed-use zones allow a single plot to generate multiple income streams commercial rental from ground-floor spaces and residential income from upper floors. Mixed-use plots in well-serviced planned areas typically appreciate faster than single-use residential plots, offering investors both current income and capital appreciation.
External Authority Reference: The UN-Habitat Urban Planning and Design
Are You Ready to Build Your Planning Expertise or Your Next Project?
The StateVision GrowthPlan framework you have just read through is the same methodology that professional town planners, development consultants, and planning firms apply on real projects across Africa and beyond. Understanding it puts you ahead of most planning students, most property investors, and most developers.
Here is what you can do next:
If you are a planning student or intern: Head to the Plan School for step-by-step studio tutorials on land use calculation, zoning map drawing, circulation design, and master plan presentation.
And if you are a developer, investor, or landowner: Visit the Plans Library to access practical planning templates, layout designs, and development frameworks you can adapt for your project.
If you need professional planning support: Explore MassodihPlans Services to discuss site assessment, master plan preparation, land use analysis, or development feasibility consultation for your specific project.
Share this article with a planning student who needs it. Bookmark it as your infrastructure planning reference. And come back because there is a lot more practical planning content being published here regularly.
Planning done right changes communities. Let us help you do it right.
Related Posts
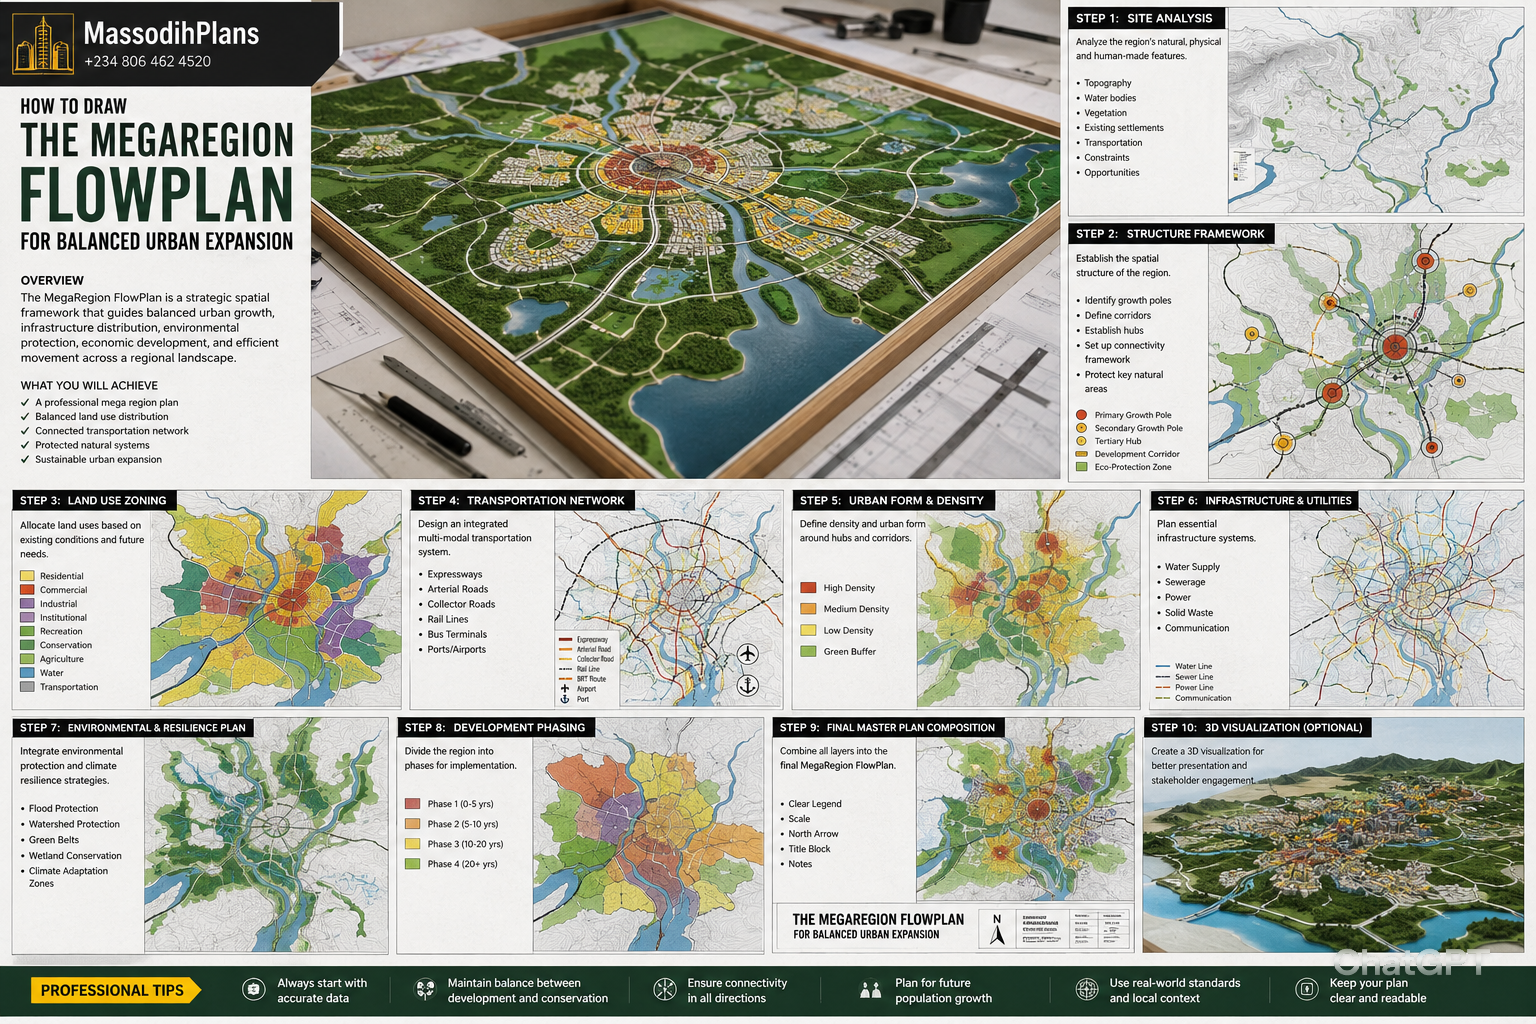
- The MegaRegion FlowPlan for Balanced Urban Expansion
- The Proposed FutureGrid Nation Blueprint for Smarter Land Development
- Industrial Estate Layout Design in Nigeria: Smart Master Plan for Small Industrial Plots
- Small Residential Estate Layout Design in Nigeria: Smart Master Plan Ideas for Limited Land